2 Literature Review
2.1 Introduction
This chapter presents a critical review of the existing theoretical foundations of research pertaining to the development of Smart Cities, Data-Driven Urban Design, and Computational Design-Toolmaking. After examining the current literature, it aims to interrelate these concepts and create an understanding that guides the development of the subsequent phases of this research. Also, the literature review is critical to identify research gaps that will support the aim and objectives of this research.
Firstly, this chapter presents a smart cities approaches in relation to the challenges faced by future cities. Secondly, this chapter provides a background theory of design to support the concepts and processes of Data-Driven Urban Design. Finally, this chapter presents an overview of Computational Design, exploring the process of toolmaking in relation to the development of Future Smart Cities.
2.2 Smart Cities Development
This section presents an overview of the theoretical background of smart cities approaches and its relation to future cities challenges.
2.2.1 Cities’ Complexity
In the mid-1960s, a systematic theory for urban planning, based on General System Theory and Cybernetics, emerged as an alternative to the physical planning of post-Second War textbooks (Taylor 1998). This systematic period viewed cities as aggregated entities in equilibrium, and scholars believed that they could be controlled and managed similarly to a machine, by clustering subsystems in hierarchical structures.
However, the systematic approach to urban planning was criticised by scholars of historical materialism during the 1970s and 1980s for its abstraction and apolitical stance (Portugali 2000). Additionally, the foundations of systematic thinking were built on the idea of closed, well-balanced, centrally organised, top-down systems, with a hierarchical structure as the dominant aspect. This old systemic view of cities did not consider that cities are systems that affect and are affected by the environment through a process that is “far from equilibrium” and are open to the aggregation of new agents (Batty 2013b).
Jacobs (1961) and later Alexander (1964a) observed that a city’s diversity and variety do not have a rigid hierarchical ‘tree-like’ structure. Instead, the city arranges segregated sub-clusters of functions in patterns, where elements may be unrelated to other parts of the system. These criticisms led to the division of urban theories into two disconnected fields: quantitative-positivist regional planning and qualitative-hermetic social theory (Portugali 2000).
In recent decades, complex theory has emerged, stating that systems follow a bottom-up behaviour, are open, unbalanced, and decentralised (Batty 2009). This has opened the way for the development of a theory in which social, political, and economic aspects are part of a self-organising urban system (Portugali 2000). In short, a complex urban system consists of interconnected or interwoven systems/agents that interact with each other, and such a system grows hierarchically based on the interactions of its primary components (Bar-Yam 1997; Batty 2013b).
Recent literature suggests that cities are complex systems (Portugali 2000; Alexander 2002; Nikos Angelos Salingaros 2005; Pumain, Bretagnolle, and Daude 2006; Hillier 2007; Batty 2009, 2013b; S. Marshall 2009; Bettencourt and West 2010; Nikos A. Salingaros 2012). As a complex system, cities are networks of systems in which different agents interact with each other, and there is an overlap of the various layers of material and immaterial entities. These systems constantly exchange material, energy, data, food, capital, information, people, and knowledge through a multidimensional process of feedback loops.
City dynamics can be understood in terms of flows and networks (Batty 2013b). The flows and networks are different sides of the same coin, with flows being the quantifiable patterns of movement and exchange in time and space, while networks are the physical or ethereal structures that support and distribute flows (Castells 1989; Portugali 2000; Batty 2013b).
Furthermore, city dynamics occur at the level of the entire urban system, and local decisions can have an impact across different city scales through the interactions and collective decisions of a multitude of agents through a bottom-up process, resulting in the emergence of urban patterns that evolve over time and space.
An illustration of the concept of the propagation of agents in urban patterns can be seen in the theory of Bettencourt and West (2010), which shows that if a city doubles in population, it will require an increase of only 85% in infrastructure, resulting in an average systematic saving of 15% on infrastructure production. This suggests that higher density is more efficient when considering the same infrastructure. Additionally, they argue that there is a correlation between density and other city indicators that follow the same “15% rule”. However, while the systematic increase in population can lead to an increase in the production of goods, resources, and ideas, it can also lead to issues such as traffic congestion, crime, and disease at the same rate, following the “15% rule” (Bettencourt and West 2010).
The tensions – far from equilibrium – between antagonistic socio-political and economic forces of different agents drive and shape how cities will evolve, defining the challenges that these cities will face in the coming decades. According to Schwab and Buehler (2018), the world will face three main challenges that will impact the well-being of future generations: rapid urbanisation, climate change, and resource scarcity.
In the next sections, this complex scenario of tensions between different socio-political views is presented in relation to the different smart cities views, which have a common goal of addressing urban development challenges using Information Communication Technologies (ICT). This PhD seeks to create an understanding of this complex and diverse scenario to propose an integrated approach that acknowledges differences and connects views from an urban design perspective.
2.2.2 Future Cities’ Challenges
According to Schwab and Buehler (2018), around 200,000 people per day are moving from rural to urban areas, demanding infrastructure alongside healthy and affordable sustainable housing for these people. However, cities generate up to 70% of greenhouse gas emissions (Bibri 2019), which are considered the main contributor to climate change. Furthermore, cities are responsible for between 60% – 80% of the consumption of energy resources (Albino, Berardi, and Dangelico 2015) and are the largest consumers of raw materials; therefore, cities can be considered significant contributors to resource scarcity in the future. As a result, future cities will be both the scenario and the producers of challenges that will impact society in the coming decades (Batty, Bettencourt, and Kirley 2019).
The interrelation between urbanisation, climate change, and resource scarcity illustrates how these challenges are interconnected in a complex network. Considering the rapid urbanisation occurring in both developed and developing countries, while on the one hand there is an increase in employment opportunities, technological advancements, and the well-being of populations; on the other hand, if uncontrolled and unbalanced, there is an increase in the emergence of slums, shrinking of green spaces, and haphazard growth areas (Sharma et al. 2019). Uncontrolled urbanisation affects the entire ecosystem, from environmental threats to urban inequality problems. For example, as cities increase in population, they become more vulnerable to environmental disasters, whether natural or human-made. Additionally, global climate change exacerbates these environmental threats, as evidenced by the increased frequency of extreme weather events in recent decades, such as tsunamis, flooding, earthquakes, and heatwaves, among other phenomena (Sharma et al. 2019; Chan and Neo 2018).
Furthermore, urban sprawl increases the demand for energy and reduces agricultural land and available water sources, impacting the production of goods. Additionally, uncontrolled growth in urban centres will impact the reduction of green spaces. Combining these factors, the price of food will increase, disproportionately influencing the most vulnerable populations as water and land resources become scarcer (Chan and Neo 2018). Finally, the phenomenon of scarcity threatens the provision of essential goods for the population, contributing to the increase of inequality between classes, as there is an increase in the number of poor people in many cities and a tendency for capital centralisation in the hands of a few people.
It is crucial to develop new strategies for effective governance and management of the development of future cities, enhancing the lives of citizens despite the challenges of inevitable urbanisation. As cities increase in population, becoming more complex and diverse, governments must deal with more political, socio-economic agents, demanding the convergence of different visions that seek a common purpose in policies and the need for collaboration among multi-stakeholders on different scales.
Cities share common challenges related to the management of urban growth. However, beside the similarities between cities, many of these problems are associated with the uniqueness of each city, where different political, social, and economic contexts rule. Policymakers, planners, researchers, and other stakeholders are working to design new strategies to enhance performance and sustainability in cities, and some of them are seeking to achieve these goals through so-called “smart city” approaches.
2.2.3 Smart Cities Approaches
According to Caragliu, Del Bo, and Nijkamp (2011), the term “smart” refers to intelligent solutions that enable cities to achieve quantitative and qualitative improvements in productivity. Hollands (2008) suggests that a smart city is one that improves economic and political efficiency to support sociocultural and urban development. However, there is ongoing debate in academia over the various approaches and methods used to achieve these goals through the concept of smart cities.
The term “smart” has been used in many ways when discussing smart cities. Some authors use it to refer to a positivist view of the city, where technological innovation and the use of ICTs are central to the concept. This view aligns with the concepts of the “wired city” (Dutton, Blumler, and Kraemer 1987), “digital city” (Ishida 2000), “telecommunications” (Graham and Marvin 2002), “informational city” (Castells 1991), and “intelligent city” (Komninos 2012). The term has also been used in relation to e-governance (Van der Meer and Van Winden 2003), urban growth, and social and environmental sustainability (Satterthwaite 1999; Polese and Stren 2000), the knowledge economy (Holbrook, Wolfe, et al. 2002; Javier 2006), and creative cities (Florida 2005). The term “smart” encompasses a wide range of meanings and is used by actors and scholars with varying perspectives and goals. Table 2.1 summarises the different meanings attributed to the smart city concept, and Figure 2.1 illustrates the evolution of the smart city concept over time. Both Table 2.1 and Figure 2.1 show the diversity of meanings of the smart city concept along the time varying between human-driven and technological-driven approaches.
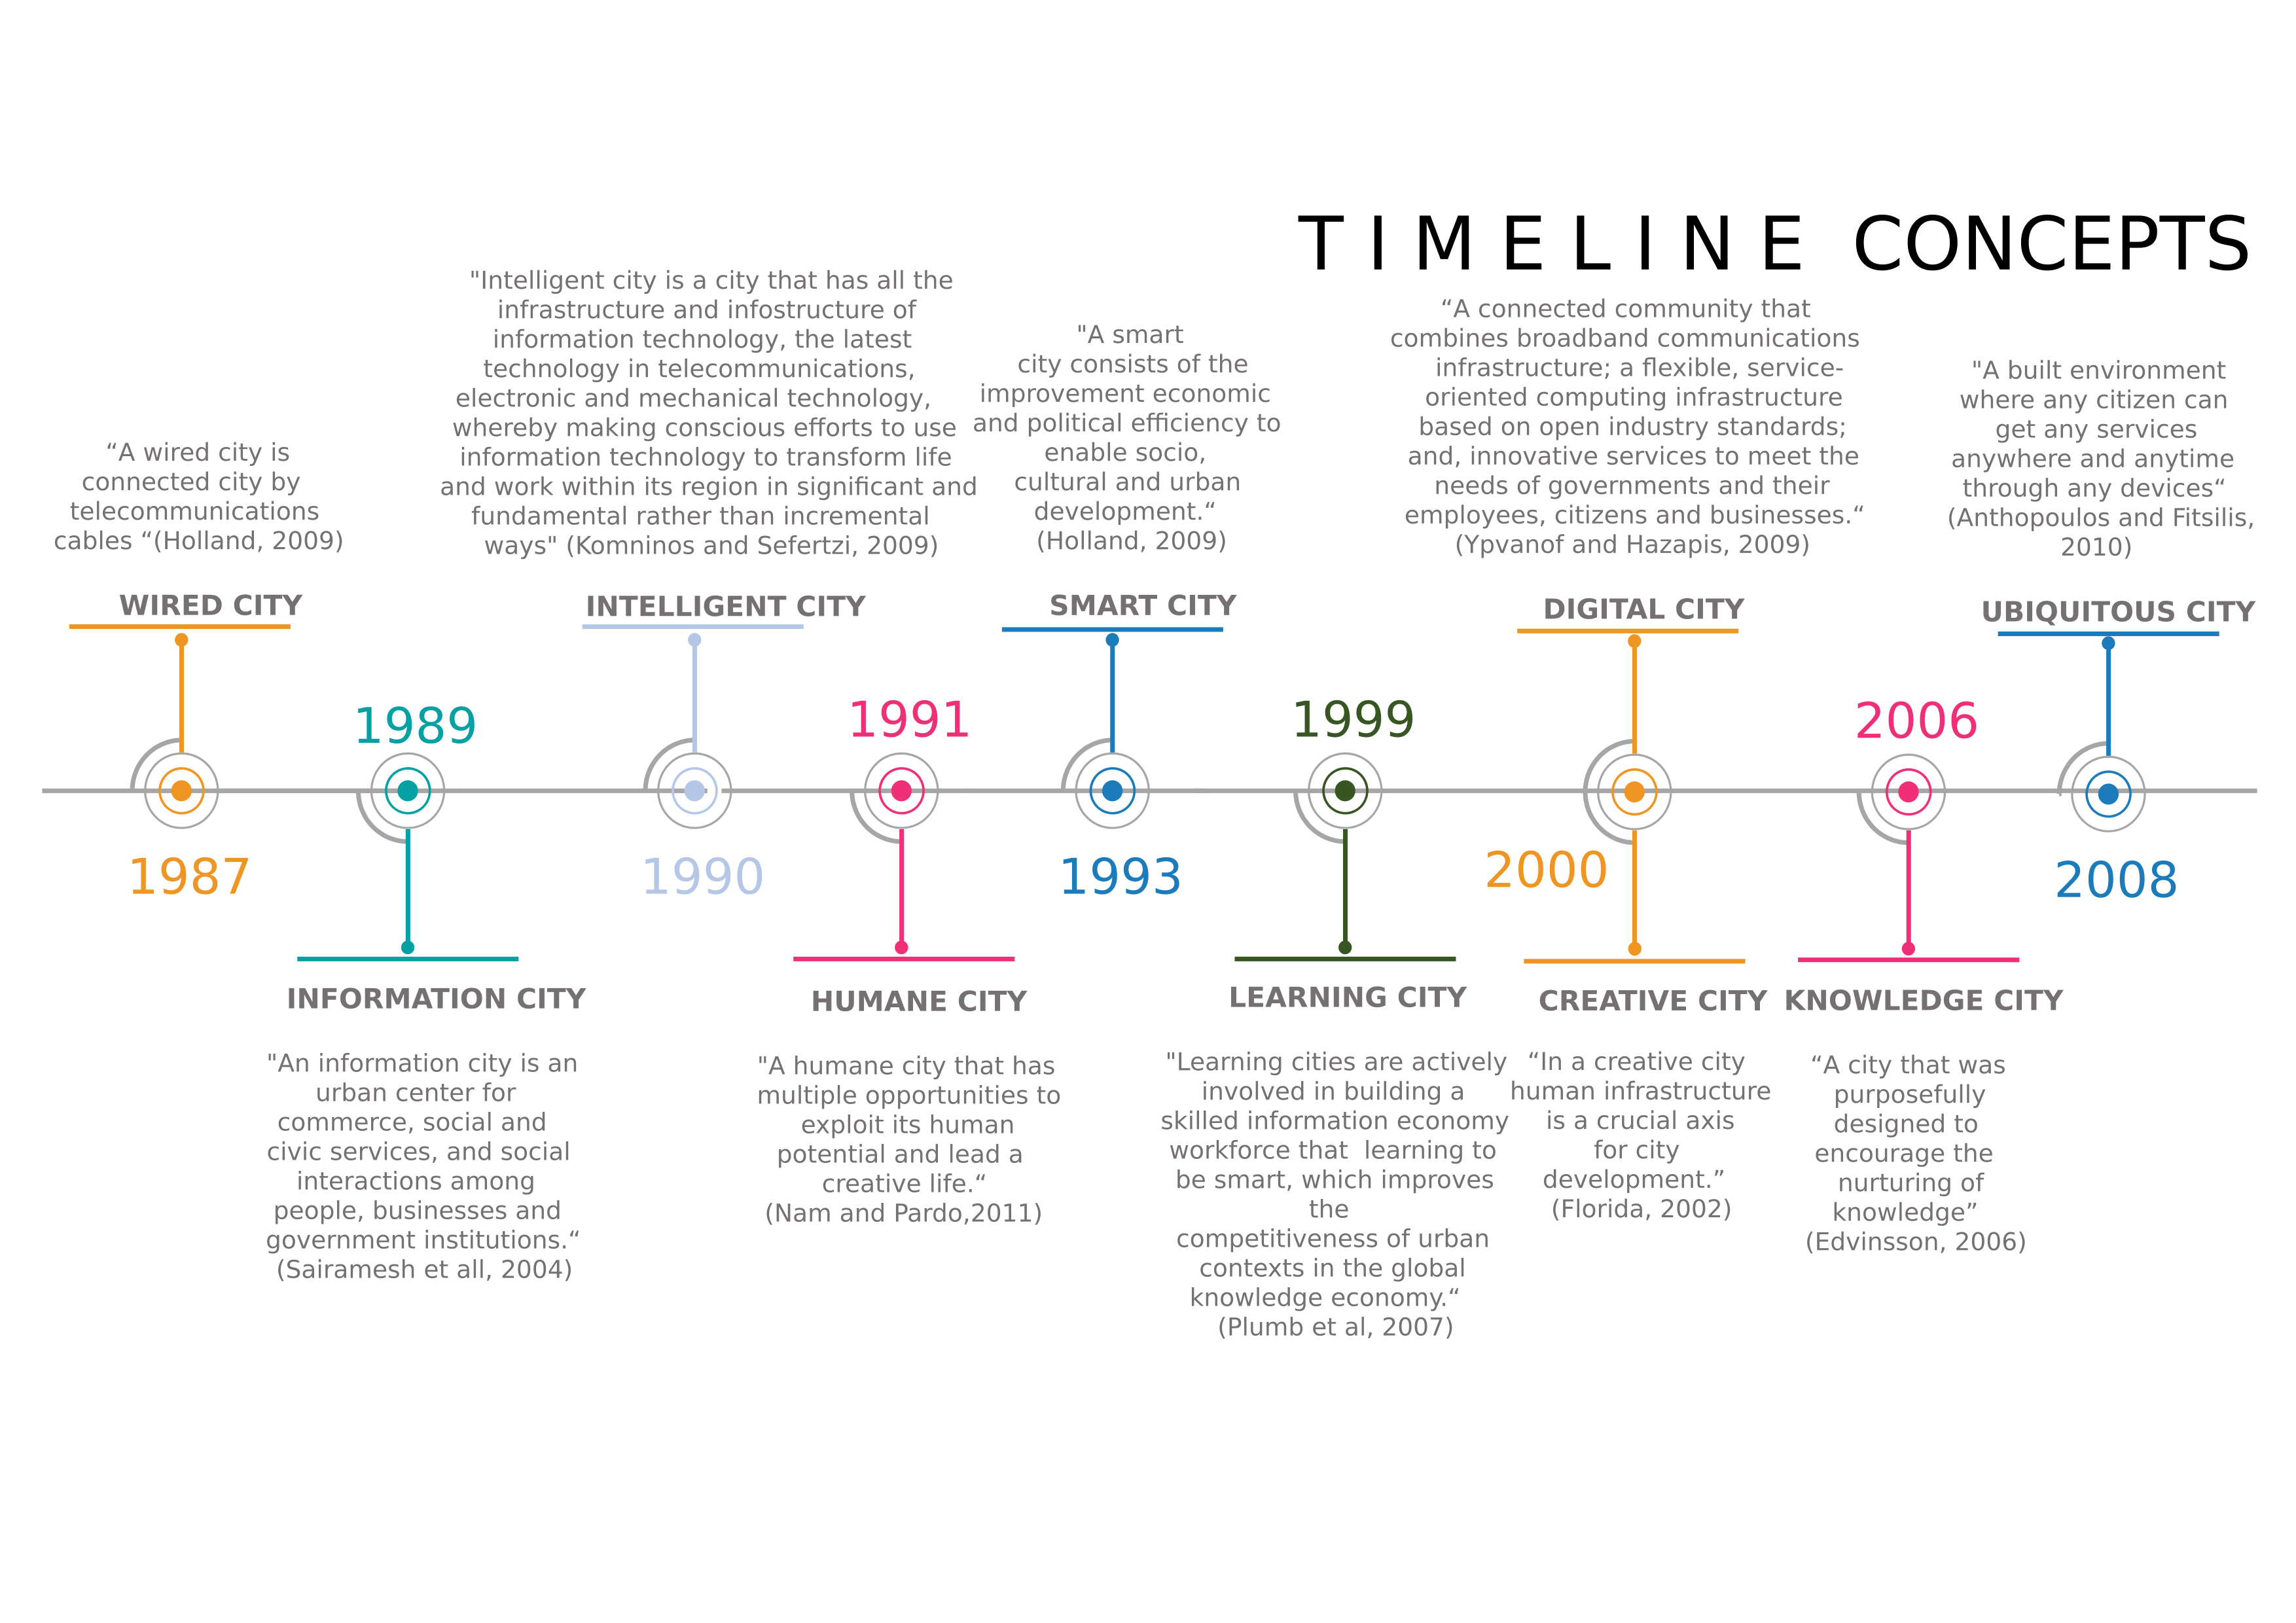
Figure 2.1: Timeline of `smart’ concepts and definitions
| Year | Author | Definition |
|---|---|---|
| 2002 | (Komninos 2012) | ‘Cities as territories with high capacity for learning and innovation, which is built into the creativity of their population, their institutions of knowledge creation, and their digital infrastructure for communication and knowledge management.’ |
| 2004 | (Partridge 2004) | ‘A city where the ICT strengthen the freedom of speech and the accessibility to public information and services’ |
| 2009 | (Hollands 2008) | ‘A city that gives the inspiration to share culture, knowledge, and life, a city that motivates its inhabitants to create and flourish in their own lives’ |
| 2010 | (Harrison et al. 2010) | ‘A city is connecting the physical infrastructure, the IT infrastructure, the social infrastructure, and the business infrastructure to leverage the collective intelligence of the city.’ |
| 2011 | (Caragliu, Del Bo, and Nijkamp 2011) | ‘A city is smart when investments in human and social capital and traditional (transport) and modern (ICT) communication infrastructure fuel sustainable economic growth and high quality of life, with a wise management of natural resources, through participatory governance.’ |
| 2012 | (Lombardi et al. 2012) | ‘The application of information and communications technology (ICT) with their effects on human capital/education, social and relational capital and environmental issues is often indicated by the notion of a smart city.’ |
| 2013 | (Dameri 2013) | ‘A smart city is a well-defined geographical area, in which high technologies such as ICT, logistic, energy production, and so on, cooperate to create benefits for citizens in terms of well-being, inclusion and participation, environmental quality, intelligent development; it is governed by a well-defined pool of subjects, able to state the rules and policy for the city government and development.’ |
| 2014 | (Kitchin 2014) | ‘Smart city is a term that describe cities that, on the one hand, are increasingly composed of and monitored by pervasive and ubiquitous computing and, on the other, whose economy and governance is being driven by innovation, creativity and entrepreneurship, enacted by smart people.’ |
| 2015 | (Al Nuaimi et al. 2015) | ‘A city which invests in ICT-enhanced governance and participatory processes to define appropriate public service and transportation investments that can ensure sustainable socio-economic development, enhanced quality-of-life, and intelligent management of natural resources.’ |
| 2016 | (Lara et al. 2016) | ‘A community that systematically promotes the overall well-being for all of its members, and flexible enough to pro-actively and sustainably become an increasingly better place to live, work and play.’ |
| 2017 | (Anthopoulos 2017) | ‘The utilisation of ICT and innovation by cities (new, existing or districts), to sustain in economic, social and environmental terms and to address several challenges dealing with six (6) dimensions (people, economy, governance, mobility, environment and living)’ |
| 2018 | (Silva, Khan, and Han 2018) | ‘A Smart City is an urban environment that utilizes ICT and other related technologies to enhance performance efficiency of regular city operations, and quality of services (QoS) provided to urban citizens’ |
| 2019 | (Bibri 2019) | ‘A smarter city can be understood as a city where advanced ICT is combined with physical, infrastructural, architectural, operational, functional, and ecological systems across many spatial scales, as well as with urban planning processes and governance models, with the primary aim of improving sustainability, efficiency, equity, and liveability.’ |
According to Letaifa (2015), some scholars prefer a technology-driven approach (TDM), while others opt for a human-driven method (HDM) when studying smart cities. In Kummitha and Crutzen (2017), the author proposes the 3RC Framework, which categorises smart city concepts into three schools of thought: restrictive, reflective, and rationalistic or pragmatic. The framework also includes a critical school of thought that criticises the smart city concept.
The restrictive school of thought, as categorised by Kummitha and Crutzen (2017), considers ICT as the essential component for transforming cities into smart cities. However, this school of thought does not mention social inclusion or social justice as necessary factors for implementing smart city practices. The reflective school of thought questions the goals adopted by the restrictive school and emphasises the positive power of ICTs by integrating human elements within their construction. This school of thought believes that technology should enhance human capacity and improve social order. On the other hand, the rationalistic school of thought argues that smart cities should focus on people and their capabilities rather than solely on technology. They believe that empowering communities and promoting skills and capabilities are essential aspects of developing a smart city. The rationalistic school of thought emphasises that citizens should be able to invent and promote the use of technology to solve their problems.
In contrast to the other schools of thought, the critical school critiques the self-proclaimed “smartness” of cities. This school argues that large corporations, such as IBM and Cisco, use smart city implementation as a neoliberal strategy to privatise urban spaces globally. Additionally, Vanolo (2014) suggests that governments use urban data technologies as a tool for regulation and control over urban systems in smart cities.
A more integrated view of the concept of smart cities has been described by a range of researchers (Giffinger and Pichler-Milanovic 2007; Lombardi et al. 2010, 2012; Caragliu, Del Bo, and Nijkamp 2011; Kar et al. 2017), which includes the use of ICTs, public policy, sustainability, citizen participation, and urban development. The literature highlights six main dimensions in the development of smart cities: the smart economy, smart mobility, smart environment, smart people, smart living, and smart governance, as shown in Table 2.2. These dimensions are related to neoclassical economic theories of urban growth and development, such as regional competitiveness (smart economy), transport and ICT economics (smart mobility), natural resources (smart environment), human and social capital (smart people), quality of life (smart living), and participation of society members (smart governance) (Caragliu, Del Bo, and Nijkamp 2011; Lombardi et al. 2012; Albino, Berardi, and Dangelico 2015). These fundamental concepts, which gave rise to the smart city’s dimensions, are briefly defined in Table 2.3:
| DIMENSION | AUTHOR |
|---|---|
| Smart Economy | According to (Lombardi et al. 2012), a smart economy should provide an ambience to innovation, seeking to enhance the entrepreneurial spirit among people in society. The focus indicators for the smart economy are public expenses on education, research and development, and the percentage of gross domestic product (GDP), which includes the unemployment rate, average annual household income, percentage of the project funded by civil society, business activities, financial intermediation, and commercial services. |
| Smart Mobility | The concept of smart mobility is founded on the idea of providing infrastructure and mobility systems addressing the needs of the citizens. Also, ICT technologies should be used in the development and the management of such platforms/devices. |
| Smart Environment | Smart Environment is the smart city’s dimension that is related to sustainable issues. In this context, an integrated policy should be implemented to monitor and improve environmental performance. Management of gas emissions, high efficiency in energy consumption and production, good management of water resources, and strategies to treat green spaces (Lombardi et al. 2012). |
| Smart People | The central core of the concept of smart people is to enhance people’s education, creativity and participation in public life (Kar et al. 2017). An important indicator for smart people is the Human Development Index (HDI), and there are some demands that smart people should attend, being open-minded, carrying a sense of democratic thoughts, and participating in public life. |
| Smart Living | Smart cities have to guarantee leisure areas for the citizens, such as public areas, parks, libraries, and cinemas. The smart living concept aims to achieve this requirement for people. Moreover, a city has to develop infrastructure with international standards, including world-class universities and hospitals. Also, smart cities should provide proper quality habitation for the citizens, in which easy access to the infrastructure is granted (Lombardi et al. 2012). |
| Smart Governance | Smart Governance is related to the practices and policies of sharing information with the citizens in an open and transparent system that allows the general public to obtain this information, stakeholders’ participation in the process of decision-making for the improvement of urban services, and public and private partnerships (Kar et al. 2017). |
| Theory | Definition |
|---|---|
| Regional Competitiveness | The capacity of an urban economy to bring and sustain firms with balanced or rising market shares in activity whilst keeping or expanding benchmarks of living for those who take part in it (Storper 1997; Porter 2000; Kitson, Martin, and Tyler 2004) |
| Transport and ICT economics | Correlation of economic development and the innovation capabilities of transportation of people and goods from one place to another (Kirkman et al. 2002; Ben-Elia and Zhen 2018) |
| Natural resources economics | Management of natural resources in the economy to ensure the availability of those resources for future generations (D. A. Anderson 2010) |
| Human capital and Social Capital | Human Capital measures the economic value of people and their skills, while Social Capital is related to the network of relationships among people who participate in a particular society (Bourdieu 1986; Hanifan 2003). |
| Quality of Life | A benchmark for expectations of an individual or society for a good life (Ventegodt, Merrick, and Andersen 2003; Grifoni, D’Onofrio, and Sargolini 2018) |
| Participation of Society Members | A people-centred decision-making process in which there is the involvement of intended beneficiaries in the planning, design, implementation, and management of a development intervention (Arnstein 1969; Buchy, Ross, and Proctor 2000) |
Following the same reasoning, the European Smart Cities Project built a web-platform to benchmark European cities through an integrative approach based on the framework of Giffinger and Pichler-Milanovic (2007). The first three versions (version 1.0-2007, version3 n 2.0-2013, and version 3.0-2014) focus on medium-sized cities with populations ranging from 100,000 to 500,000 inhabitants, while the fourth version (4.0-2015) focuses on larger European cities with populations between 300,000 and one million inhabitants (Giffinger et al. 2015). The project aims to identify strengths and weaknesses in order to ensure and extend comparative advantages in certain key resources against other cities at the same level (Giffinger et al. 2015). The fourth version covers 1,600 cities listed on the Urban Audit database, and the criteria used to choose which cities would be included in the project was that more than 80% of the indicators should be available on this database.
Built upon the previous framework and in partnership with Barcelona, Buenos Aires and other leading cities around the world, B. Cohen (2012) conceived the smart cities wheel as an holistic framework that adds and distributes 18 action domains, and 47 indicators across the six dimensions previously developed by the Giffinger and Pichler-Milanovic (2007) framework, as Table 2.4 shows. Figure 2.2 illustrates the wheel.
| Dimension | Domain | Indicators |
|---|---|---|
| Smart Economy | Entrepreneurship & Innovation | New Startups, R + D, Employment Levels, and Innovation |
| Productivity | GDP per capita | |
| Local/Global Interconnectedness | Exports, International Events Hold | |
| Smart Mobility | Efficient Transport | Clean-energy Transport |
| Multi-modal Access | Public Transport | |
| Technology Infrastructure | Smart cards, and access to real-time information | |
| Smart Environment | Green Energy | Energy |
| Green Buildings | Sustainable-Certified Buildings, and Smart Homes | |
| Green Urban Planning | Climate resilience, Density, and Green Space per capita | |
| Smart People | Embrace Creativity | Foreign-born immigrants, Urban Living Lab, and Creative Industry jobs |
| Inclusive Society | Internet-connected households, smartphone penetration, civic engagement | |
| 21st Century Education | Secondary Education and University Graduates | |
| Culturally Vibrant & Happy | Living Conditions, Gini index, Quality of life Index, Quality of life ranking, and Investment in Culture | |
| Smart Living | Safe | Crime and Smart Crime Prevention |
| Healthy | Single Health History | |
| Smart Governance | Enabling Supply & Demand-side policy | Wi-fi Coverage, Broadcast Coverage, Sensors Coverage, and Integrated Health + Safety operations |
| Transparency & Open Data | Open Data, Open Apps, and Privacy | |
| ICT & e-Gov | Online Procedures, Electronic benefits Payments |
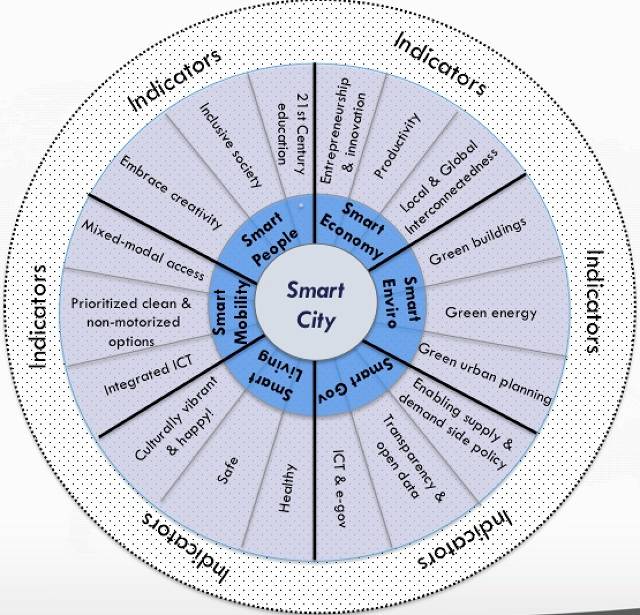
Figure 2.2: Smart Cities Wheel from B. Cohen (2012)
Similar to the framework proposed by Giffinger and Pichler-Milanovic (2007), Lombardi et al. (2012) propose a framework that relates industry, university, and government, identifying five categories in their analysis: smart human capital, smart governance, smart environment, smart economy, and smart living.
Kar et al. (2017) develop another perspective on the integrated approach to smart cities. The authors argue that a broader and more holistic view of the smart cities’ concept needs to be developed, seeking to unite concepts across different perspectives, rather than an isolated view of each smart city dimension. Also, according to the same authors, the smart cities’ concept would remain incomplete if not considering the multiple aspects of city management, which include urban governance, public policy, engineering, and process management.
Neirotti et al. (2014) provide an overview of the domains in which smart technologies can be applied and divide those domains into “Hard” (tangible) and “Soft” (intangible) categories. “Hard Domains” include office and residential buildings, energy grids, natural resources, energy and water management, waste management, environment, transport, mobility, and logistics; whilst education, culture, social inclusion, and e-government were framed as “Soft Domains” (Neirotti et al. 2014, 27). Furthermore, the authors propose a conceptual framework divided into six domains and 26 subdomains, as shown in Table 2.5.
| DOMAIN | SUB.DOMAIN |
|---|---|
| Natural Resources and Energy | Smart Grid, Public Lightning, Green/Renewable energy, waste management, water management, and Food and Agriculture |
| Transport and Mobility | City Logistics, Info-mobility, and People Mobility |
| Buildings | Facility management, Building Services, and Housing quality |
| Living | Entertainment, Hospitality, Pollution control, Public Safety, Healthcare, Welfare and social inclusion, Culture, and public spaces management |
| Government | E-government, E-democracy, Procurement, and Transparency |
| Economy and people | Innovation and entrepreneurship, Cultural heritage management, Digital Education, and Human Capital management. |
Considering a different perspective to describe an integrated approach, Ramaprasad, Sanchez-Ortiz, and Syn (2017) propose a high-level ontology seeking to unify the concept of smart cities, deconstructing the meaning of smart cities into functions that describe the concept through the combination of 25,200 possible instances of smart city definitions, as shown in Figure 2.3. This framework makes it possible to conceptualise systematically across multiple dimensions of smart cities’ development. According to Ramaprasad, Sanchez-Ortiz, and Syn (2017), the Smart City Ontology aims to provide a tool for scholars, planners, and government officials to assess levels of smartness through multiple dimensions, guide cooperative thinking among various stakeholders, provide guidelines for the development of future smart cities, and map the state-of-practice to “unveil the bright, light, and blind/blank spots of cities” (Ramaprasad, Sanchez-Ortiz, and Syn 2017, 21).
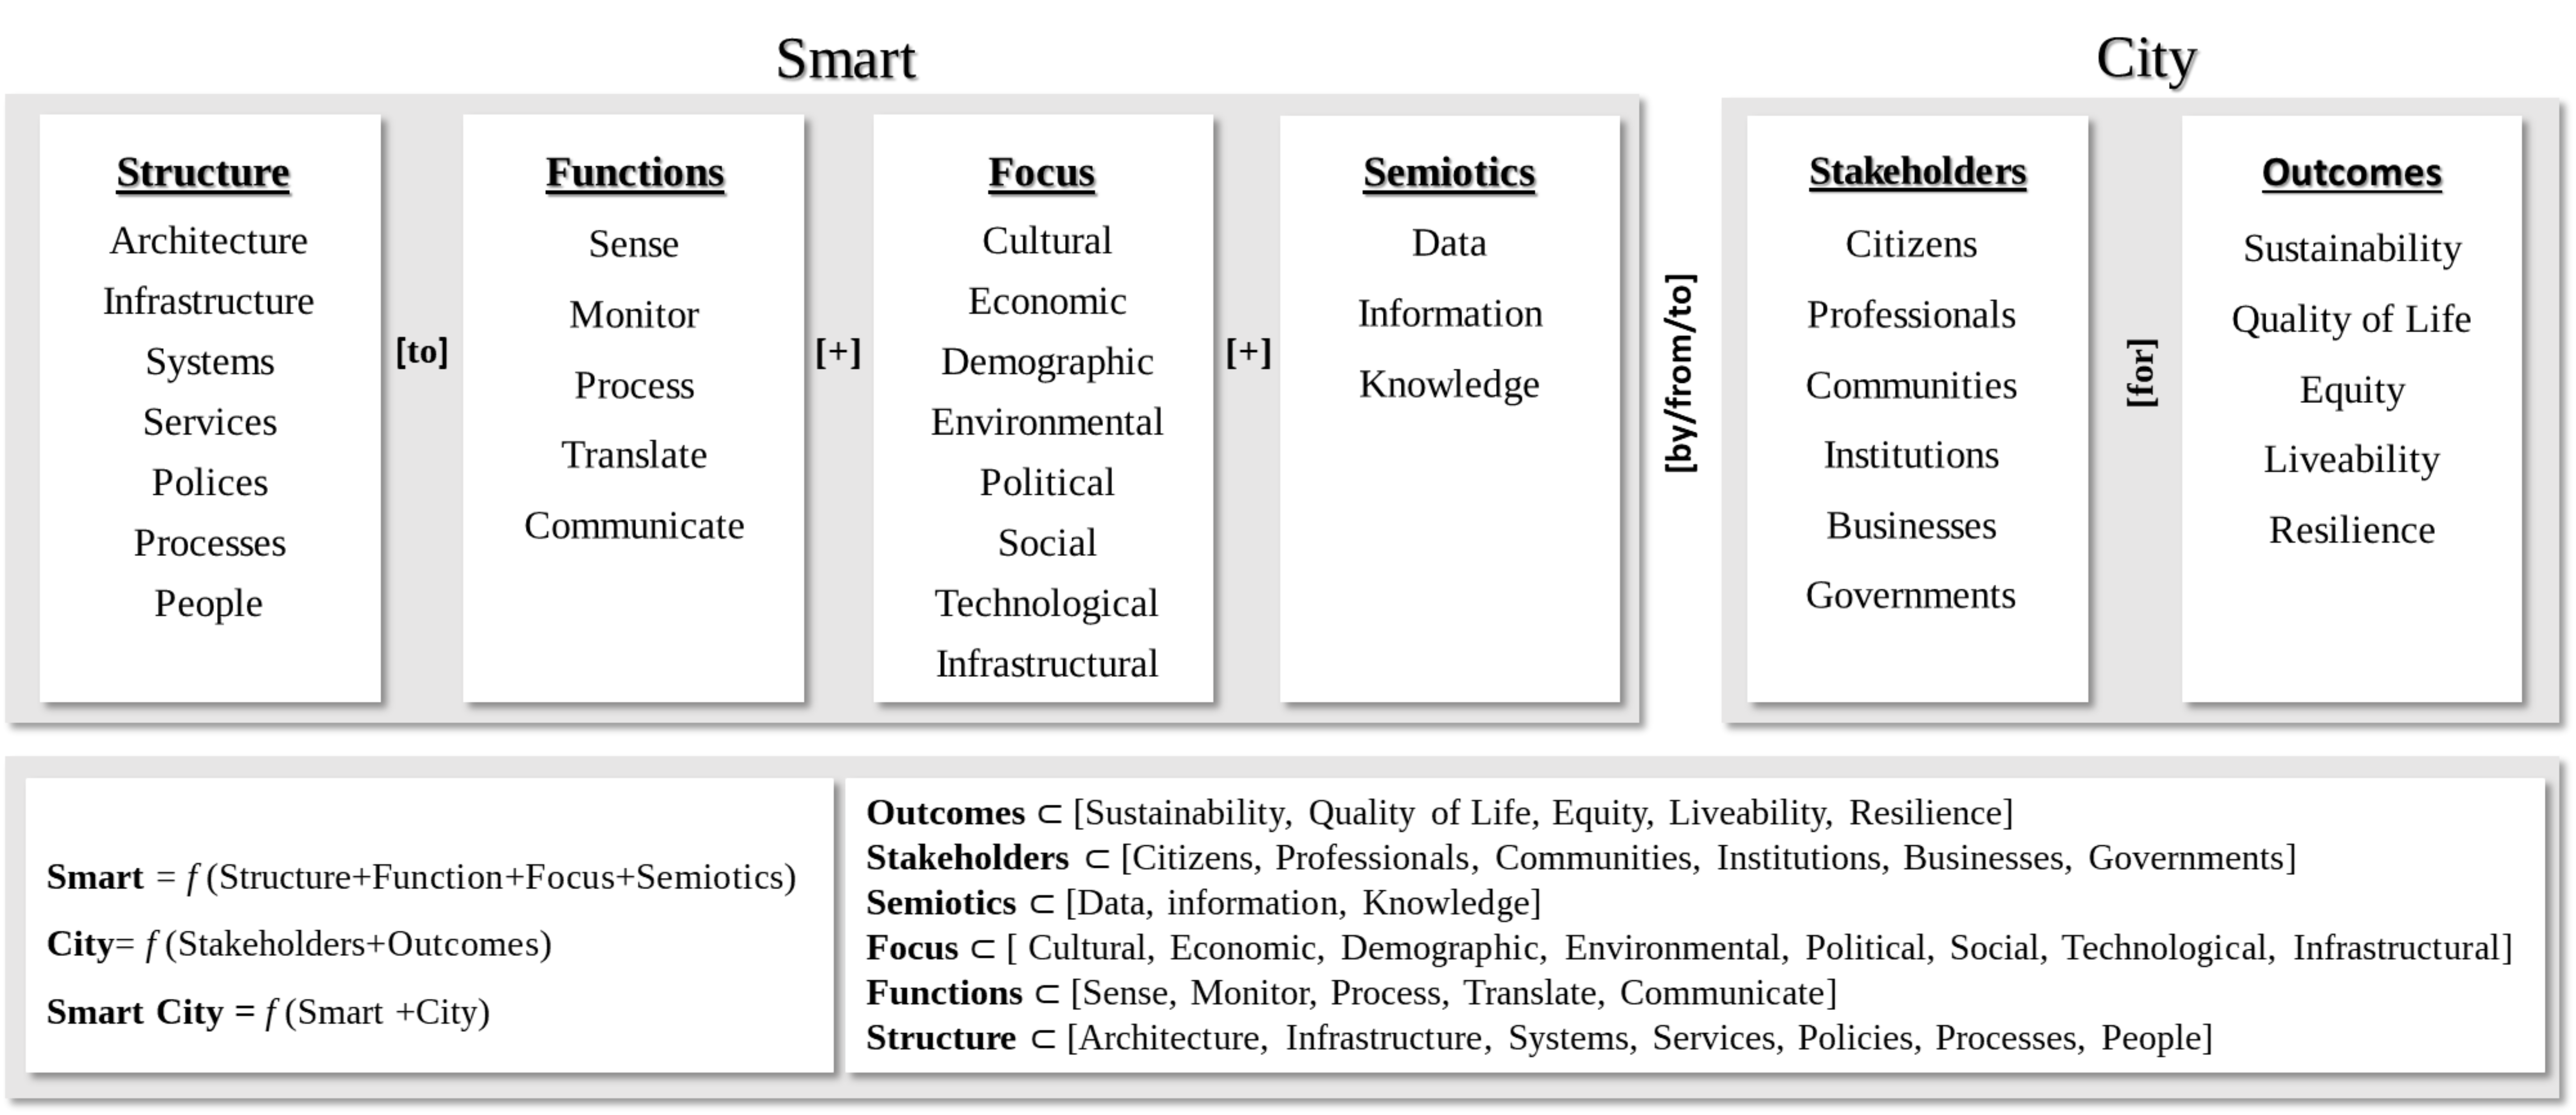
Figure 2.3: Smart City High-Level Ontology adapted from Ramaprasad, Sanchez-Ortiz, and Syn (2017)
The International Organisation for Standardisation (ISO) made an important step in the development of an integrated approach for Smart Cities’ Development through the first edition of ISO 37122-2019, which defines standards for indicators to measure progress towards a smart city. This standard is part of an holistic and integrated approach to sustainable development, including the first edition of ISO 37120-2014, later replaced by ISO37120-2018, which defines a standard for city services and quality of life. Another standard for this holistic approach is currently under development, ISO/DIS 37123, which will define indicators for resilient cities. Together, these three standards, as shown in Figure 2.4, compose an holistic and integrated view of sustainable development, in which the indicators and associated methods, according to ISO 37129, “(a) measure performance management of city services and quality of life over time; (b) learn from one another by allowing comparison across a wide range of performance measures; and, (c) support policy development and priority setting” (ISO 2019).
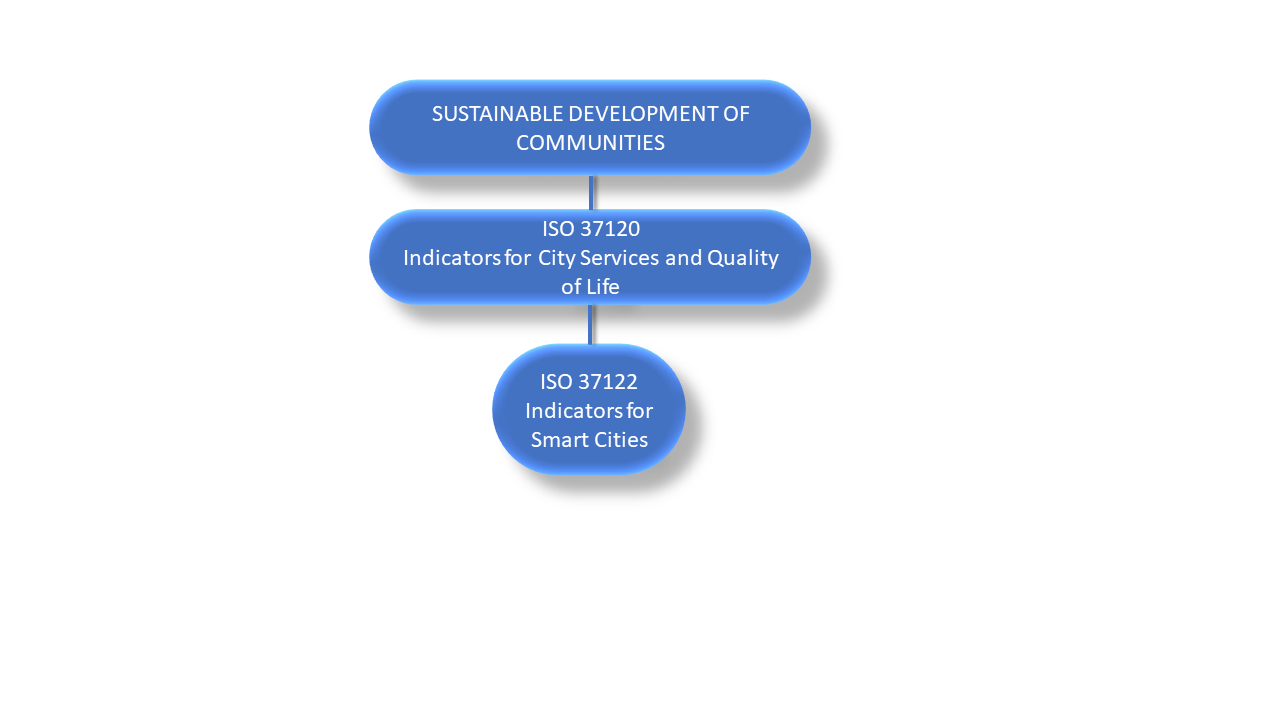
Figure 2.4: Sustainable development of communities adapted from ISO (2019)
ISO 37122-2019 establishes indicators through definitions and methodologies, considering aspects and practices that increase the pace at which cities improve social, economic, and environmental sustainability (ISO 2019). Table 2.6 shows the indicators and measurements used in ISO 37122-2019; these indicators and measures should be used in addition to ISO 37120-2014 to implement smart policies, programs, and projects that are related to:
“(a) respond to challenges such as climate change, rapid population growth, and political and economic instability by fundamentally improving how they engage society; (b) apply collaborative leadership methods, work across disciplines and city systems; (c) use data information and modern technologies to deliver better services and quality of life to those in the city (residents, businesses, visitors); (d) provide a better life environment where smart policies, practices and technology are put to the service of citizens; (e) achieve their sustainability and environmental goals in a more innovative way; (f) identify the need for and benefits of smart infrastructure; (g) facilitate innovation and growth; (h) build a dynamic and innovative economy ready for the challenges of tomorrow.”(ISO 2019, 1)
| Indicators | Measurements |
|---|---|
| Culture | Number of library book titles per 100 000 population |
| Number of library e-book titles per 100 000 population | |
| Active library users as a percentage of the total population | |
| Economy | Percentage of local businesses contracted to provide city services which have data communication openly available. |
| Annual number of new start-ups per 100 000 population | |
| Percentage of the labour force employed in the Information and Communications Technology (ICT) sector | |
| Percentage of the labour force employed in the Education and Research / Development sectors | |
| Education | Number of online databases available through public libraries per 100 000 population |
| Percentage of city population with professional proficiency in one or more foreign languages | |
| Number of computers, laptops, tablets, or other digital learning devices available per 1 000 primary school students | |
| Number of computers, laptops, tablets, or other digital learning devices available per 1 000 secondary school students | |
| Number of Science, Technology, and Mathematics (STEM) higher education degrees per 100 000 population | |
| Energy | Electrical and thermal energy (KWh) produced from wastewater treatment per capita per year |
| Electrical and thermal energy (KWh) produced from solid waste treatment per capita per year | |
| Percentage of the city’s energy that is produced using decentralised energy production systems | |
| The storage capacity of the city’s energy grid per capita (KWh) | |
| Energy consumption of public street lighting as a percentage of the total annual municipal energy consumption | |
| Percentage of street lighting that has been refurbished | |
| Percentage of public buildings requiring renovation/refurbishment (by floor area) | |
| Environment and Climate Change | Percentage of ecosystems that are mapped by remote sensing monitoring |
| The annual frequency of ecosystem remote sensing monitoring | |
| Percentage of buildings built or refurbished within the last five years in conformity with green building principles | |
| Number of real-time ICT-based air quality monitoring stations per 100 000 population | |
| Finance | Percentage of municipal budget spent on smart city innovations and initiatives per year |
| The annual amount of tax collected from the sharing economy as a percentage of the total tax | |
| Percentage of payments to the city that are paid electronically based on electronic invoices | |
| Governance | Annual number of online visits to the municipal open data portal per 100 000 population |
| Number of datasets offered on the municipal open data portal per 100 000 population | |
| Percentage of the municipal datasets available to the public | |
| Percentage of city services accessible online | |
| Average response time to relevant inquiries made through the city’s non-emergency inquiry system (days) | |
| Health | Percentage of the city population with online unified health file accessible to health care providers |
| Annual number of medical appointments conducted through telecommunication or online video services per 100 000 population | |
| Percentage of the city population registered with public alert systems for air and water quality advisories | |
| Percentage of city area covered by an Electromagnetic Fields radiation mapping systems | |
| Housing | Percentage of households with smart electricity meters |
| Percentage of total land area that is a mixed-use zone | |
| Percentage of households with smart water meters | |
| Population and Social Conditions | Percentage of public buildings that are accessible by persons with disabilities |
| Percentage of municipal budget allocated for provision of mobility aids, devices, and assistive technologies to citizens with disabilities | |
| Number of persons with disabilities that have real-time ICT-based interactive mapping applications per 100 000 population | |
| Percentage of marked pedestrian crosswalks equipped with accessible pedestrian signals | |
| Recreation | Percentage of public recreation services that can be booked online |
| Number of municipal smart kiosks installed per 100 000 population | |
| Safety | Percentage of the city area covered by digital surveillance cameras |
| Percentage of city population registered with a public safety alert system | |
| The annual number of social media posts by municipal public safety officials per 100 000 population | |
| Solid Waste | Percentage of the city population that has waste drop-off centres equipped with telemeters |
| Percentage of the city population that has a door-to-door garbage collection with an individual telemeter of household waste quantities | |
| Percentage of the total amount of waste in the city that is used to generate energy | |
| Telecommunication | Percentage of the city population with access to computers or other electronic devices with internet access in libraries and other public buildings |
| Percentage of the city population with access to sufficient speed broadband | |
| Percentage of city areas under a white zone/dead spot/not covered by telecommunication connectivity | |
| Percentage of city areas with publicly available internet connectivity | |
| Transportation | Percentage of city streets and thoroughfares covered by real-time online traffic alerts and information |
| Number of users of sharing economy transportation per capita | |
| Percentage of vehicles registered in the city that are low-emission vehicles | |
| Number of bicycles available through bicycle-sharing services per 100 000 of the population | |
| Percentage of public transport lines equipped with a real-time ICT-based systems | |
| Percentage of the city public transport network covered by a unified payment system | |
| Percentage of public parking spaces equipped with e-payment systems | |
| Percentage of public parking spaces equipped with real-time ICT-based availability systems | |
| Percentage of traffic lights that are intelligent/smart | |
| City areas mapped by real-time interactive street maps as a percentage of the city’s total land area | |
| Urban/Local Agriculture and Food Security | Annual percentage of municipal budget spent on urban agriculture initiatives |
| Annual total collected municipal food waste sent to a processing facility for composting per capita (in tonnes) | |
| Urban Planning | Annual number of citizens engaged in the planning process per 100 000 population |
| Average time for building permit approval (days) | |
| Percentage of the city population living at medium-to-high population densities | |
| Wastewater | Percentage of treated wastewater being reused |
| Percentage of sludge that is reused (dry matter tonnes) | |
| Energy derived from waste-water as a percentage of total energy consumption of the city | |
| Percentage of the total amount of waste-water in the city that is used to generate energy | |
| Water | Number of real-time ICT-based drinking water quality monitoring stations per 100 000 population |
| Number of real-time ICT-based environmental water quality monitoring stations per 100 000 population |
Summing up, the six smart cities dimensions - Smart Environment, Smart Economy, Smart Governance, Smart People, Smart Living, and Smart Mobility, which are related to neoclassical economic theories of urban growth and development (regional competitiveness, transport and ICT economics, natural resources, human and social capital, quality of life, and participation of society members) are the current most accepted dimensions in the majority of smart cities’ frameworks (Giffinger and Pichler-Milanovic 2007; B. Cohen 2012; Neirotti et al. 2014; Ramaprasad, Sanchez-Ortiz, and Syn 2017; Bibri 2018), with slight differences between them. For example, Lombardi et al. (2010) indicate that the framework does not include the smart mobility dimension, even though the framework was designed through a focus group, including experts in different fields. Neirotti et al. (2014) presents a framework in which the Smart Environment is represented by the Natural Resources and Energy domain along with the Buildings domain. Another important aspect is that some of these frameworks use indicators to track and measure the city’s development towards a smart city (Giffinger and Pichler-Milanovic 2007; Lombardi et al. 2010; B. Cohen 2012; Neirotti et al. 2014), while others do not have such indicators (Ramaprasad, Sanchez-Ortiz, and Syn 2017; Bibri 2018).
Moreover, all authors discuss Information and Communication Technology (ICT) to define the smart city dimensions. According to Bibri and Krogstie (2017b), ICT is a set of “urban infrastructures, architectures, systems, applications, systems, and data analytics capabilities” (Bibri and Krogstie 2017b), which includes hardware elements, such as RFID, GPS, smart sensors, wearable devices, smartphones, computers, database systems, internet infrastructure, wireless communication, amongst others, and software applications such as big data analytics techniques (e.g., natural language processing, machine learning, data mining, and statistical analysis), modelling and simulation tools, visualisation methods, real-time operation methods, and database integration, among others.
An example of an ICT system is the city dashboard concept (Pettit, Lieske, and Jamal 2017). The dashboard is a way of presenting a set of different indicators through a common interface, and it was first introduced in the automobile industry. The smart city concept borrowed the dashboard concept as a way of collecting and providing the city’s information via an integrated platform. It gained visibility with the popularisation of initiatives such as cities’ open data initiatives and projects such as The World Council on City Data (WCCD), which provides data, maps, and a dashboard for over 30 cities through a website and a portal (Pettit, Lieske, and Jamal 2017). Some examples of city dashboards are those used by Sydney1, Dublin2, London3, and Melbourne4.
However, as noted by Bibri and Krogstie (2017a), ICT is used interchangeably with the theory of Urban Computing, and further explanation is needed to differentiate these two theories. ICT theory is concerned with the applications and their impacts on society, while Urban Computing Theory deals with how the ICT systems are conceived, developed, and designed, as well as how they will function in an urban environment (Bibri and Krogstie 2017a).
The intersection between Urban ICT and Urban Computing results in the “smart” dimension of the smart cities’ theory in most well-accepted smart cities frameworks. However, it is still not clear what distinctions are between these theories in most of those frameworks. In all presented frameworks, there are convergent and divergent points, revealing that smart city theory is still under development in a heated debate in academia, and there is no single theory that includes all the aspects of smart cities’ development.
Table 2.7 summarises divergent and convergent points between frameworks, reinforcing the idea that an inclusive and integrated framework for smart cities development is needed, including the six dimensions, indicators, and a proper definition of the smart dimension.
| Features | Giffinger and Pichler-Milanovic (2007) | Lombardi et al. (2010) | B. Cohen (2012) | Neirotti et al. (2014) | Kar et al. (2017) | Ramaprasad, Sanchez-Ortiz, and Syn (2017) | Bibri (2018) |
|---|---|---|---|---|---|---|---|
| ICT | x | x | x | x | x | x | x |
| Urban Computing | x | x | |||||
| Indicators | x | x | x | x | |||
| Smart Environment | x | x | x | x | x | x | x |
| Smart Economy | x | x | x | x | x | x | x |
| Smart Governance | x | x | x | x | x | x | x |
| Smart People | x | x | x | x | x | x | x |
| Smart Living | x | x | x | x | x | x | x |
| Smart Mobility | x | x | x | x | x | x |
Despite divergences in smart cities’ epistemological views (Kummitha and Crutzen 2017), smart cities’ approaches agree on the main goal, which is the use, implementation, and development of Information Communication Technologies (ICTs) to boost cultural, social, and urban development (Hollands 2008; Letaifa 2015).
While the concept of smart cities is still being developed, there are concerns regarding cities that currently consider themselves to be “smart”. These cities often prioritise the implementation of technology and data analytics to improve urban performance, with the belief that urban development will naturally follow. However, the mere implementation of technology does not necessarily lead to greater equity and sustainability within a city, unless these issues were already being addressed prior to the adoption of smart technologies (Zheng et al. 2020). Therefore, a truly integrated approach to smart cities cannot be achieved through technological development alone, as cities are complex systems (Batty, Bettencourt, and Kirley 2019). A top-down approach that relies heavily on private companies to provide closed technological solutions for various urban problems, without considering how people’s behaviour and agency are affected by the built environment, as well as how the availability of smart devices, apps, and platforms (e.g., smartphones, social media, or routing tools), may have unforeseen bottom-up consequences on social, economic, and environmental aspects (Zvolska et al. 2019). Current efforts to use information and communication technology (ICT) to drive cities towards smart development often focus on the implementation of constantly evolving devices and software to collect and analyse data, potentially prioritising ICT infrastructure over the multidimensional aspects of smart cities.
Recently, multinational computing giants such as IBM, Cisco, Siemens, HP, and Microsoft have also begun to play a significant role in the design and building of future smart cities, with the aim of achieving efficiency and well-being. If during the modernism period, Le Corbusier proposed “Ville Radieuse” as a response to the rise of the automobile and mass production, today’s smart cities’ momentum is based on computer power and internet connectivity, seeking to address issues of sustainability and efficiency (Ratti and Claudel 2016).
One of the most prominent examples of this is Songdo, a city located in South Korea, which began to be built in 2004 with the significant involvement of Cisco Systems. The city development was designed to be fully integrated with smart technologies, including the ability to monitor and control various systems, such as transportation and utilities (Ratti and Claudel 2016). Songdo has gained global attention and serves as a model for other smart cities projects. However, if in theory smart cities advocate that stakeholders should be involved in the decision-making process, empirically, Songdo’s administration has demonstrated a tendency for centralised government-led economic smart cities’ development through a market-driven scheme that controls everyday urban life through ubiquitous surveillance (Breuer et al. 2019). Recently, Songdo’s administration has been trying to review their smart cities vision, including “everyday life services”, focusing on local needs and characteristics rather than overemphasising the implementation of new smart infrastructures alone (Y. Lim, Edelenbos, and Gianoli 2022).
If cities are complex-adaptive systems (Bettencourt and West 2010; Batty, Bettencourt, and Kirley 2019) that result from a constant evolving plurality of views that converge to its materialisation from a synergetic force coming from a crowd (Ratti and Claudel 2016), empowering and engaging citizens through bottom-up strategies are crucial for successful smart cities’ development. According to Batty (2017), in the age of smart cities, the latest wave of digital technologies allows individuals to engage with each other, compute and communicate, and become virtual global citizens with immediate access to a vast amount of data and information. These technologies enable people to connect and participate in a decentralised manner, creating a bottom-up approach of communication and access to resources.
This rationale follows the idea of “Hack the city”, which, according to Ratti and Claudel (2016), refers to the process of breaking the mindset of optimised urbanism by opening traditionally closed information systems. By doing so, citizens can be empowered to take a more active role in shaping their environment. Using open-source technologies, a diverse group of citizens can contribute their knowledge, skills, and ideas in order to bring about real change. While bottom-up characteristics can have a positive impact at the local level, they often conflict with the objectives of decision-makers, urban planners, and the dynamics of the globalised economy. The unpredictable nature of bottom-up processes can be at odds with the idea of a master plan (Eynard, Santangelo, and Tabasso 2014).
From the duality of top-down and bottom-up approaches, data-driven urban design can potentially explore the middle ground of these approaches, combining people’s values and urban form to envision future cities and societies that are guided by visions, goals, and propositions, while also being grounded in data and performance criteria that drive system changes. The modelling and analysis of data can inform urban design to create evidence-based innovative designs for cities and urban spaces (Yang and Yamagata 2020).
In recent years, urban design has begun to incorporate a data-driven approach with the advent of smart infrastructure, technology, data science methods, and access to city open data (Karakiewicz 2010; Deutsch 2015; Kvan 2020; Gösta et al. 2020). Designers have utilised computational tools and service platforms to facilitate the urban design process by gathering, analysing, and visualising data to generate evidence-based design propositions (Picon 2015; Kvan 2020).
From a smart cities’ perspective, data-driven urban design could assist in bridging divergent epistemological smart cities approaches, such as the technology-driven method (TDM) and the human-driven method (HDM) (Kummitha and Crutzen 2017), through a middle ground in-between top-down and bottom-up strategies, establishing a mechanism for feedback loops between citizens, the built environment, and future design visions.
2.2.4 Summary of Smart Cities Development
This section presented a summary of the smart cities approach, which has been used to tackle future cities’ challenges, and described its different socio-political views through the 3RC Framework (Kummitha and Crutzen 2017). It also presented an overview of current smart cities’ approaches (Giffinger and Pichler-Milanovic 2007; B. Cohen 2012; Neirotti et al. 2014; Ramaprasad, Sanchez-Ortiz, and Syn 2017; Bibri 2018), showing that, despite their slight differences, they have the same goal: the use, implementation, and development of Information Communication Technologies (ICTs) to boost cultural, social, and urban development (Hollands 2008; Letaifa 2015). However, self-proclaimed smart cities initiatives have shown that the mere implementation of technology through a top-down approach does not necessarily lead to greater equity and sustainability within a city (Zheng et al. 2020), indicating that public engagement through a middle ground of top-down and bottom-up strategies is necessary to truly start to build smart cities initiatives. Data-driven urban design is one of the strategies that can establish a mechanism of feedback loops between citizens, the built environment, and future design visions, connecting the gap between top-down and bottom-up strategies. This PhD uses data-driven urban design to start to bridge these approaches through a middle ground that connects top-down and bottom-up strategies from a perspective that considers multiple urban design dimensions. Therefore, the next section provides concepts and theories that compose the necessary background information to understand data-driven urban design.
2.3 Data-Driven Urban Design
This section presents concepts and theories that support an understanding of data-driven urban design processes.
2.3.1 Background Theory of Design
In a broader sense, design refers to every plan that we make for something that will happen in the future, such as trying a new cuisine recipe, our plans for the holidays, a new arrangement for the living room, among other day-to-day plans (Lawson 2006; Cross 2011). All those daily tasks require some level of design. However, there is a group of professionals (architects, interior designers, product and industrial designers, urban and landscape designers) who generate objects or places through design that may have a more profound impact on people’s quality of life (Lawson 2006). The action of “design” refers to the practice(s) of those professionals.
Mahmud Rezaei (2020) provides a comprehensive framework in which the action of “design” can be classified and understood from different perspectives: manner of thinking, process direction/orientation, position, design scope, designer’s role, design tools and sources, and place and time. This framework categorises these ways of thinking about “design”, providing a background theory that is crucial for understanding of the context in which design artefacts are developed. The categories of the framework are further explored below.
- Design defined as a Manner of Thinking
Design defined as a “manner of thinking” can be divided across a spectrum ranging from empiricism to rationalism. The post-World War II period marks the beginning of systematic research into architectural design methods, as, before this era, most studies around design processes were based on intuition and the empirical nature of the design process (Mahmud Rezaei 2020).
For Jones (1970), the design process can be divided into four eras: the “Craft Evolution”, the “Design by Drawing”, the “System Design”, and the “Technological Change”.
The first era, the “Craft Evolution”, refers to a period prior to the Renaissance, where the craftsman creates their work through a heuristic trial-and-error process, directly connecting their minds with their hands. The craftsman uses their experience to guide their subjective decisions, in which there is no clear distinction between representation and artefact, as there is no separation between thinking and making.
The second era, the “Design by Drawing”, refers to the period from the Renaissance to 1950, and its main characteristic is the separation between thinking and making, using drawings as the medium. One of the benefits of this separation is that it became possible to have a division of labour across different people. This potential division of labour increased the rate of production and made collaboration among different craftsmen possible to realise potentially bigger projects. The separation of the intellectual work of planning the artefact and the process of manufacturing it, starts to define a new kind of worker who “designs” the artefact for others to manufacture.
The third era, the “System Design”, established post-World War II, with the emergence of design methods groups and a systematic understanding of the design process. Under this new paradigm, decisions that were previously implicit, made by the designer through their subjective judgement, should now be explicit, explaining all the steps that the designer made and why they made them, like a “glass box” (Jones 1970). From this period, the seminal work “Notes on the Synthesis of Form” (Alexander 1964b) was published, proposing a technique for organising design issues that would enable designers to visually depict the structure of non-visual issues through graphical representation.
Finally, the last era, “Technological Change”, the current era, is characterised by socio-technical innovation, and relies on the need to integrate social changes with technological ones, throughout the radical transformation of both social organisations and man-made systems (Jones 1970).
Following this perspective, Salama (1995) argues that there are three models of the design process. The first is the “intuitive method”, which takes a “black box” approach and involves the design process occurring in the designer’s brain without logical or reasonable control. This model includes various approaches such as pragmatic, iconic, analogical, and canonical design. The second model is the “rational or problem-solving model”, which uses an explicit approach and aims to find an acceptable solution to a design problem. This model is characterised by defining objectives, variables, and criteria before finding solutions, and is represented by systematic design and a pattern language (Jones 1970). The third model is the “participatory model”, which is based on the “community design” or “action research” approach, emphasising the importance of involving people in the decision-making process to consider their ideas, values, and needs (Salama 1995).
- Design defined as the Process of Direction/Orientation
Design defined as the “Process of Direction/Orientation” concerns both the product and the process of design and is divided into procedural and substantive theories (Mahmud Rezaei 2020). Substantive design views focus on the physical nature of the artefact, investigating the “whys” of designing, while procedural views focus on the process used to make the artefact, exploring its “how”. From this perspective, regarding its orientation, the design process may transition between considering the overall design to considering specific details, adopting a problem-oriented or solution-oriented approach and may focus on either synthesising or analysing information. The design process may involve moving from an internal to an external perspective or vice versa. There has been much research within different fields examining whether design follows a bottom-up or top-down direction.
According to the “RIBA Practice and Management Handbook” (Ostime 2019), the design process is divided into four phases:
Assimilation: This phase involves the collection of both general and specific information related to the design problem.
General Study: During this phase, designers explore the nature of the problem and consider a variety of potential solutions.
Development: In this phase, designers work to develop one or more potential solutions to the design problem.
Communication: The final phase involves communicating the chosen solution/s to the client.
Asimow (1962) views design as a problem-solving process that involves synthesis, evaluation, and analysis. In this approach, the designer begins by synthesising potential solutions to the design problem, evaluating the merits of each solution, and then analysing the most promising options in greater detail. This iterative process allows the designer to arrive at a final solution that effectively addresses the needs and constraints of the design context. It is worth noting that Asimow’s perspective on the design process aligns with other approaches that emphasise the importance of synthesis, evaluation, and analysis in design problem-solving, as Figure 2.5 shows.

Figure 2.5: Analysis, Synthesis, Evaluation from Asimow (1962)
Markus (1969) and Maver (1970) present a more comprehensive view of the design process, arguing that design must progress through the decision sequence of analysis, synthesis, appraisal, and decision at increasingly granular levels of the design process. They state that design requires a decision sequence, as Figure 2.6 shows.
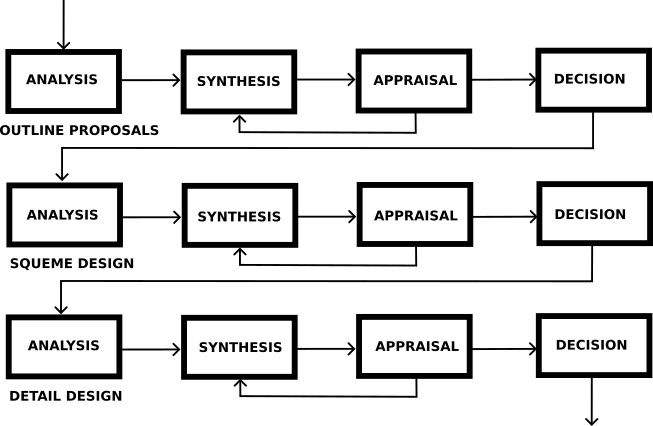
Figure 2.6: Markus/Maver design Process Model from Markus (1969) and Maver (1970)
Lawson (2006) criticises this sequential approach to the design process, arguing that the design process should not suggest any firm path, since design consists of analysis, synthesis, and evaluation, which are linked in an iterative cycle, so those steps should be interconnected in a non-sequential manner, as Figure 2.7 illustrates.
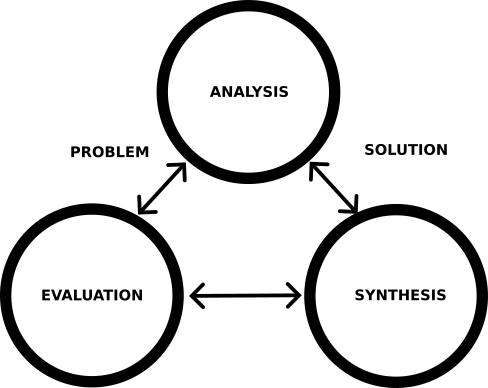
Figure 2.7: Design Process adapted from Lawson (2006)
Dorst (2003) argues that design involves a set of needs, requirements, and intentions applied to a specific circumstance, and the synthesis of this process results in an artefact with an intended use. This process follows non-deductive reasoning, whereby the design problem is an open process involving needs, requirements, and intentions, resulting in an artefact related to usability. This open process in the design problem is called “underdetermination” of design problems (Dorst 2003, 2), which designers overcome through a step-by-step process between well-defined problems and ill-defined problems. When the problems are well-defined, a single, correct solution can be provided; for example, specifications and rules on the design code, which will inform the design as determined constraints. On the other hand, when the problem is ill-defined, more than one satisfactory or good solution can be provided, depending on the subjective judgement of the designer. Whole combinations of unfindable possibilities for a unique design are part of the creative process of the exploration of the “solution space” (Cross et al. 1984; Cross 2011). The exploration of the solution space is a complex iterative process of “design, reflection, modification, and re-design” (Oxman 2017, 3).
According to Schön (2017), architects should not be confined to addressing only predefined problems, but rather should have agency in determining the problem of design themselves. The problem formulation process involves designers identifying and defining the subjects they are interested in and establishing a context for their work. This framework enables designers to make informed decisions and leads to the development of new insights.
For Gero (1990), it is uncommon for the structure of a design to be generated directly from requirements, except in the case of a simplistic design problem. In Gero’s FBS ontology, which is a cognitive model to understand design process through the relation of its function, behaviour and structure, the design synthesis is created from an expected behaviour derived from the requirements, and the structure (artefact) is generated based on this expected behaviour. This expected behaviour represents the anticipated causal sequence of interactions.
Gero’s FBS ontology (1990) has been widely utilised in cognitive studies (Gero and Tang 1999; J. W. Kan and Gero 2005; J. Kan and Gero 2009; Kannengiesser and Müller 2013; Yu 2014; Hurst et al. 2019; Sanderson, Chaplin, and Ratchev 2019; Becattini et al. 2020; Kahlon and Fujii 2022) due to its ability to potentially encompass a significant portion of meaningful design processes and its clear classification of transitions between cognitive steps of design processes.
The FBS ontology consists of three categories of variables: Function (F), Behaviour (B), and Structure (S). Function (F) represents the design goals or purposes; Behaviour (B) represents the actual behaviour of the artefact (Bs) represents the behaviour derived from the structure, while (Be) represents the intended behaviour; and Structure (S) represents the components that build up an artefact and their relationships. The model is supported by two external design factors: requirements (R) and documentation (D). The first of these represents external requirements for the design, and the second refers to design documentation. Formulation defines the process of formulating a function or establishing intended goals from existing requirements, while synthesis generates a structure as a potential solution. Analysis produces a behaviour from the existing structure, and evaluation compares the actual behaviour of the artefact derived (Bs) and the intended artefact (Be) to determine the success or failure of the candidate solution. Gero proposes three reformulation steps: R1) returning from the structure to itself, R2) returning from the structure to the behaviour, or R3) returning from the structure to the function. These three reformulations iterate and rebuild the design process (Gero 1990; Gero and Kannengiesser 2014; Yu 2014). The role of the reformulations suggests innovative and creative aspects of designing, further exploring the design solution space (J. W. Kan and Gero 2005; Yu 2014). Figure 2.8 shows the interrelationships of the variables and cognitive steps of the design process.
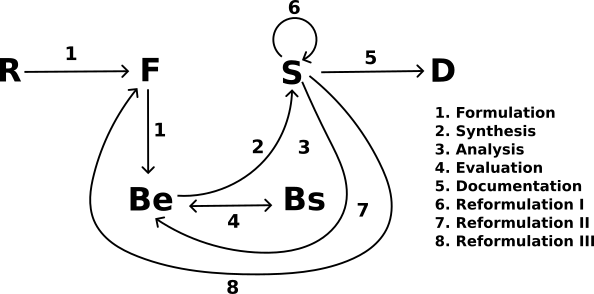
Figure 2.8: FBS ontology from Gero and Kannengiesser (2004)
In this study, the FBS ontology will be introduced as the basis model for the design process and cognitive steps for developing a framework for data-driven urban design processes.
- Design defined as Positioning
“Design defined as Positioning” evaluates the design based on its values and norms (Mahmud Rezaei 2020). One of its approaches is based on normative theories that are defined in terms of principles and rules.
Normative theories in design have been explored since the earliest architecture records. Marcus Pollo Vitruvius, in his book “de Architectura Libri Decem”, judged building according to order, arrangement, eurhythmics, symmetry, propriety, and economy (Vitruvius 1867). According to Vitruvius, architecture should not only be visually pleasing, but should also effectively serve the purposes and functions for which it was designed. He believed that order, or the organisation and structure of a building, is achieved through modulation, or the proper scaling and proportioning of the building’s parts. Arrangement, or the placement of these parts in relation to each other, plays a role in both the functionality and beauty of a building. When considering the aesthetic appeal of a building, Vitruvius identified eurhythmics, or the harmonious relationship between the parts of the building, and symmetry, or the balance and symmetry within the overall composition, as important criteria. Propriety, or the appropriateness of a building’s design for its intended purpose, and economy, or the efficient use of materials and resources in construction, are also significant considerations in the creation of a successful building. All these principles are examples of his normative approach to effectively create a building that serves its intended purpose.
During the rationalism of modern architecture, normative theories defined how designers should design. In the article “The Tall Building Artistically Considered” (Sullivan 1979), Louis Sullivan expressed his famous phrase “form follows function”. Following the same reasoning, Le Corbusier proposed five points towards a new architecture (Oechslin and Wang 1987), which aimed to define new global standards for design:
The Column (les pilotis);
The Roof-Garden (le toit-terrasse);
The Free Plan (le plan libre);
The Ribbon Window (la fenêtre en bandeau);
The Free Facade (la façade libre).
During the same period, Philip Johnson tried to align modern architecture with an international style of design. The International Style rejected traditional architectural forms in favour of a more rational, functional approach. It sought to create a universal language of architecture that could be applied to buildings anywhere in the world. This style was influential in shaping the modernist movement, and its principles can still be seen in the design of many contemporary buildings.
Critics of rationalism also made use of normative theories. The Deconstructivism movement that emerged in the late 20th century is characterised by using fragmentation, non-rectilinear shapes, and the manipulation of the structure’s surface. It is associated with architects such as Frank Gehry, Zaha Hadid, and Daniel Libeskind. Deconstructivism is seen as a response to the functionalism and uniformity of the International Style, with its emphasis on functionalism, simplicity, and the use of modern materials such as glass and steel. It rejected the idea of a universal language of architecture and instead embraced diversity and individuality. Deconstructivist architects sought to create buildings that were expressive and dynamic, rather than simply functional and efficient.
In 2009, a new normative for architecture was proposed by Schumacher, “Parametricism” (Schumacher 2009). Schumacher claims that Parametricism is a new architectural global movement established to replace modernism. According to Schumacher (2009), the principles of systematic adaptive variation, continuous differentiation, and dynamic parametric figuration should be applied to all aspects of design, from urban planning to the smallest details of building construction and interior furnishings. This approach emphasises the use of systematic and adaptable processes, rather than simple variety, in order to create highly differentiated and dynamic designs that are responsive to changing conditions and requirements. More recently, Schumacher reviewed Parametricism as Parametricism 2.0 (Schumacher 2016), in which a less dogmatic view of parametricism was suggested, understanding that parametric design should assist in solving social and environmental issues by exploring formal and functional solutions through parametric differentiations (Schumacher 2016).
- Design defined as Scope
“Design defined as Scope” aims to comprehend design from a variety of perspectives, including those of design professionals, academic disciplines, and individuals or groups, through both theoretical and practical approaches. It considers a range of dimensions in order to gain a comprehensive understanding of design.
According to Herbert Simon in his book “The Sciences of the Artificial” (Simon 1969), design is the foundation of all professions. He notes that design has various scales and has been utilised by engineering and the sciences to progress their fields. Design can be applied on a small scale, such as in the design of a single building, or on a larger scale, such as in the design of a city or consumer products. Previously, there was no distinction made between these different scales and an architect would provide professional input into all of them.
Schön (2017) asserts that professionals in the fields of engineering, architecture, management, and urban planning rely more on design techniques and innovations developed through practical experience than on their formal education during the problem-solving process. According to his research, practical thinking, which is not typically taught in schools, is more beneficial in the design process in these fields than purely technical and theoretical rationalism. Additionally, design has been integrated into the sciences and engineering, leading to a re-evaluation of processes and design methods from various perspectives due to the shared goals and direction of these three fields.
According to William J. Mitchell (1975) design is a problem-solving activity that involves “wicked problems”, while sciences and engineering deal with “tame problems”. “Wicked” and “Tame” problems were defined by Rittel and Webber (1973), according to the same authors, such that “wicked problems” are complex and multifaceted issues that are difficult to understand or solve due to their many interconnected components and lack of clear definitions. These types of problems are often found in social and political contexts, and their solutions have numerous impacts and consequences that are difficult to predict or control. “Wicked problems” are typically characterised by the following features: a lack of clear criteria for determining when a problem has been solved; a lack of agreed-upon definitions for the problem; and the existence of multiple stakeholders with conflicting values and perspectives on the problem. In the field of design, “wicked problems” can present a particular challenge due to the creative and iterative nature of the design process. Finding effective solutions to “wicked problems” in design typically requires a flexible and adaptive approach that considers the unique context of each problem and the diverse perspectives of all involved stakeholders.
- Design defined as Role
The design activity can be understood as the extent to which designers and users are actively involved in the design process. Participatory design is a method that aims to include the perspectives and input of citizens and end-users in the design process.
Participatory design approaches emerged in the 1970s and 1980s as a response to prescriptive design practices, in which the designer operates like a doctor by issuing a prescription for the design (Van der Velden, Mörtberg, et al. 2015). In participatory design, the collaborative process involves multiple participants in a mutual learning process of investigation, reflection, and action. The participants, who may serve as both users and designers, engage in a dynamic process of learning about each other’s realities and needs. Designers seek to understand the users’ context, and users seek to articulate their goals and learn about appropriate technology to achieve them (Robertson and Simonsen 2012).
From an Urban Design perspective, Bacon and Walduck (1967) argue that a central design concept can serve as the backbone for the city and act as a creative force for shaping meaningful spaces. This can be achieved through a design process that involves postponing certain aspects of the design to the implementation phase and with urban design regulations. Bacon also emphasises the importance of “democratic feedback” and participatory project review as a means of facilitating a dynamic design process that is open to communication, input, and revision.
According to Appleyard (1976), urban design is perceived differently by various stakeholders, such as planners and citizens. Planners may view the design of a city as a comprehensive, top-down process, while citizens experience the city from a ground level perspective and may have different perspectives about its design, based on factors such as their backgrounds, familiarity with the city, patterns of use, educational level, and mode of transportation.
Recently, Ratti and Claudel (2015) proposed an approach defined as Open-source architecture, referring to a design approach that utilises open-source principles, such as transparency, collaboration, and accessibility, to facilitate the creation and evolution of built environments. This approach was proposed to address the challenges and opportunities of contemporary urbanisation and technological development. Ratti argues that open-source architecture has the potential to democratise the design process, allowing for greater participation and input from a diverse range of stakeholders, and to foster more adaptable and resilient built environments. By leveraging the collective knowledge and expertise of various individuals and communities, open-source architecture seeks to create innovative and responsive design solutions that reflect the needs and values of contemporary society. Ratti further developed this rational with the concept of “Futurecraft”, which is a design approach that systematically explores and envisions possible futures, focusing on how the integration of ubiquitous computing and citizens collaborations are transforming the study of the built environment. Through this approach, design can investigate and intervene at the intersection of people, technologies, and the city, developing research and applications that empower citizens to make informed choices that contribute to a more liveable urban environment (Ratti and Claudel 2016).
- Design defined as Models and Paradigms
“Design defined as Models and Paradigms” has two main paradigms: form-oriented approaches, and philosophy and history-oriented approaches (Mahmud Rezaei 2020). Form-oriented approaches concern the formal processes and methods used by designers, while philosophy and history-oriented approaches are historically and philosophically attached to positivism, modernism, postmodernism, or critical realism (Mahmud Rezaei 2020).
In form-oriented approaches, Broadbent (1975) defines design into four paradigms: pragmatic, iconic, analogic, and canonic. Pragmatic design is a method of design that originated in prehistory, in which materials were combined through trial and error until a functional building form was achieved. Iconic design, on the other hand, involves starting with a preconceived idea of what the building should look like and reproducing a familiar form. Analogic design involves drawing visual analogies with existing buildings or forms found in nature, such as Le Corbusier’s “crab-shell” roof at Ronchamp, while canonic design involves generating form through two or three-dimensional geometric systems, a practice that dates to the Egyptians and has been employed in the design of Gothic cathedrals and Renaissance palaces. Le Corbusier’s Modulor, dimensional coordination, and prefabricated building systems are also examples of canonic design (Broadbent 1975).
Gero (1990) takes a process-oriented approach to categorising design paradigms, defining three categories: routine design, innovative design, and creative design. Routine design is characterised using established design prototypes and constraints on the range of values for variables, resulting in a limited space of potential designs. In contrast, innovative design involves manipulating variable ranges to produce designs that fall outside the routine design space while still maintaining a familiar structure. Creative design, on the other hand, involves introducing new variables, resulting in the creation of entirely new types of designs and potentially even a shift in the overall design paradigm (Gero 1990).
Terzidis (2006) argues that algorithmic design represents a paradigm shift in current design practice, as it allows for the generation of novel concepts using computational mechanisms. In algorithmic design, designers use algorithms to generate architectural forms and spaces based on rules inherent in architectural programs, building codes, typologies, and language. Rather than programming a design software from scratch, designers can use algorithmic scripts built on top of existing modelling systems to create consistent, structured, coherent, traceable, and intelligent 3D forms. These scripts allow designers to surpass the limitations of traditional 3D software and explore new design possibilities (Terzidis 2006).
From historical and philosophical perspectives, Mahmud Rezaei (2020) argues that humanity’s understanding of time and space has been shaped by advances in mathematical physics and philosophy. In the classical period, the concept of time and space was viewed as absolute, with weight being seen as a constant in physics. However, Einstein’s theory of relativity challenged this notion, showing that time is a function of place and that everything is interconnected. This shift in perspective has been reflected in the evolution of design concepts, moving from a focus on time and space in the classical period to a focus on time-space in the modern period, and ultimately to a focus on time-space-information in the contemporary period.
Philosophical theories, such as complexity science, have further influenced the way in which form and space are created in design. The ideas of philosophers such as Leibniz, Jacques Derrida, Gilles Deleuze, and Felix Guattari have inspired architects to explore concepts such as folding, fractals, chaos, and nonlinear systems in their work. In 1993, Greg Lynn cites Gilles Deleuze’s “The Fold: Leibniz and the Baroque” in stating that the use of continuous yet differentiated systems with curvilinear sensibilities allows for the creation of smooth spaces that can adapt and respond to a range of factors, including programmatic, structural, economic, aesthetic, political, and contextual influences, thus enhancing the level of adaptability in design (Lynn 1993). In the same year, Peter Eisenman discussed the concept of folding and its connection to the mathematical differential ideas of Leibniz within the context of the Cartesian mathematical geometric paradigm. Eisenman noted that Leibniz rejected Cartesian rationalism in the realm of efficient space and argued that in the continuous, sinuous space, the smallest unit is not a dot, but rather a folding (Eisenman 1993).
- Design defined by Tools
Design can be understood through the tools utilised during the design process (Mahmud Rezaei 2020). Sketching is a widely employed tool throughout history, dating back to the late 15th century, when paper became a commonly available material (Goldschmidt 1991).
Goldschmidt (1991) proposed an approach for rationalising the design process using interactive imagery. This method involves incorporating sketches into the design process and using them to address conflicts and decisions. Goldschmidt argues that the ability to distinguish between formal and non-formal visualisations allows designers to reconcile the formal design with the conceptual design (Goldschmidt 1991).
William J. Mitchell (2005) suggests that in industrial modernism, the construction of buildings is moving away from traditional physical drawings and instead utilising digital information to accomplish the production process. The idea of morphogenesis as a mechanism of form generation emerged in the realm of digital design as a process of discovering or creating emergent forms through various generative techniques (Kolarevic 2004). Leach (2009) explains that the concept of digital morphogenesis, which operates within the framework of the new morphogenetic paradigm, can be understood as the facilitator of processes that allow for the emergence of bottom-up form-finding techniques that generate structural formations.
Negroponte (1975b) believed that when designing with computers, it is essential to establish a direct interaction between designers and the machine through a collaborative human-machine process. This approach is distinct from “computerisation”, which he described as a method of processing data through batch input-output computation (Negroponte 1975b). Terzidis (2006) further discusses the differences between computation and computerisation. Computation can be defined as the act of determining something through mathematical or logical methods and is focused on the exploration of indeterminate, vague, and often ill-defined processes. Due to its exploratory nature, computation aims to emulate or enhance the capabilities of human intellect using techniques such as rationalisation, reasoning, logic, algorithms, deduction, induction, extrapolation, exploration, and estimation. Furthermore, computation also encompasses a wide range of implications such as problem-solving, mental structures, cognition, simulation, and rule-based intelligence. On the other hand, computerisation refers to the act of entering, processing, or storing information in a computer system. This process is primarily focused on automation, mechanisation, digitisation, and conversion. It primarily involves the digitisation of preconceived, predetermined, and well-defined entities or processes (Terzidis 2006). For Terzidis, this fundamental difference between computation and computerisation determines algorithm design, which is an approach based on computation, as a paradigm shift in design processes.
In the field of computational design, parametric design is understood as a methodology that employs algorithmic thinking to guide the design process. This approach uses a set of predefined parameters and rules to constrain the design solution within a specific set of boundaries (Kolarevic 2004; Jabi 2013; Yu 2014; Woodbury 2010; Caetano, Santos, and Leitão 2020). The integration of parametric design and its associated ways of thinking can expand the cognitive capacity of the design process. Explicitly articulating ideas that are commonly approached intuitively enables a deeper understanding of the design concepts in question. Additionally, the ability to express these ideas with clarity and precision serves as an indication of genuine comprehension of the subject (Woodbury 2010).
- Design defined as Place
Theories of design can be examined within the context of place (Mahmud Rezaei 2020). Norberg-Schulz (1984) argues that “places” are formed by the combination of both space and character, emphasising the critical role of architecture in contributing to the qualities and attributes of spaces, impacting the mental and physical well-being of those who experience them. Furthermore, Norberg-Schulz stresses the importance of architecture not just focusing on the symbolic or meaning making aspects, but also giving equal attention to the physical attributes of the space.
The concept of “place” has been widely studied by experts in the fields of environmental psychology, urban psychology, and human geography. These studies have focused on understanding the ways in which individuals ascribe meaning to different places and how places shape individuals’ experiences and behaviours.
Regarding urban design, Montgomery (1998) argues that an essential factor for the success of urban space is the process that makes a piece of the city be recognised as a place, in other words, what builds the sense of place during the process of place making. According to Punter and Carmona (1997) and Montgomery (1998), the sense of place can be defined into three components, as Figure 2.9 shows:
Form or the physical setting, which includes the outward appearance, formal dimensions, and the physical environment, such as the landscape, built form, and furniture;
Activity, which refers to the patterns and movements of pedestrians and motorists, as well as the accompanying noises, smells, and other sensory experiences;
The meaning or perceptual aspect, which encompasses the public imagination and individuals’ mental evaluations of a place, including their qualitative evaluations, attractions, legibility, wayfinding, and cultural significance.
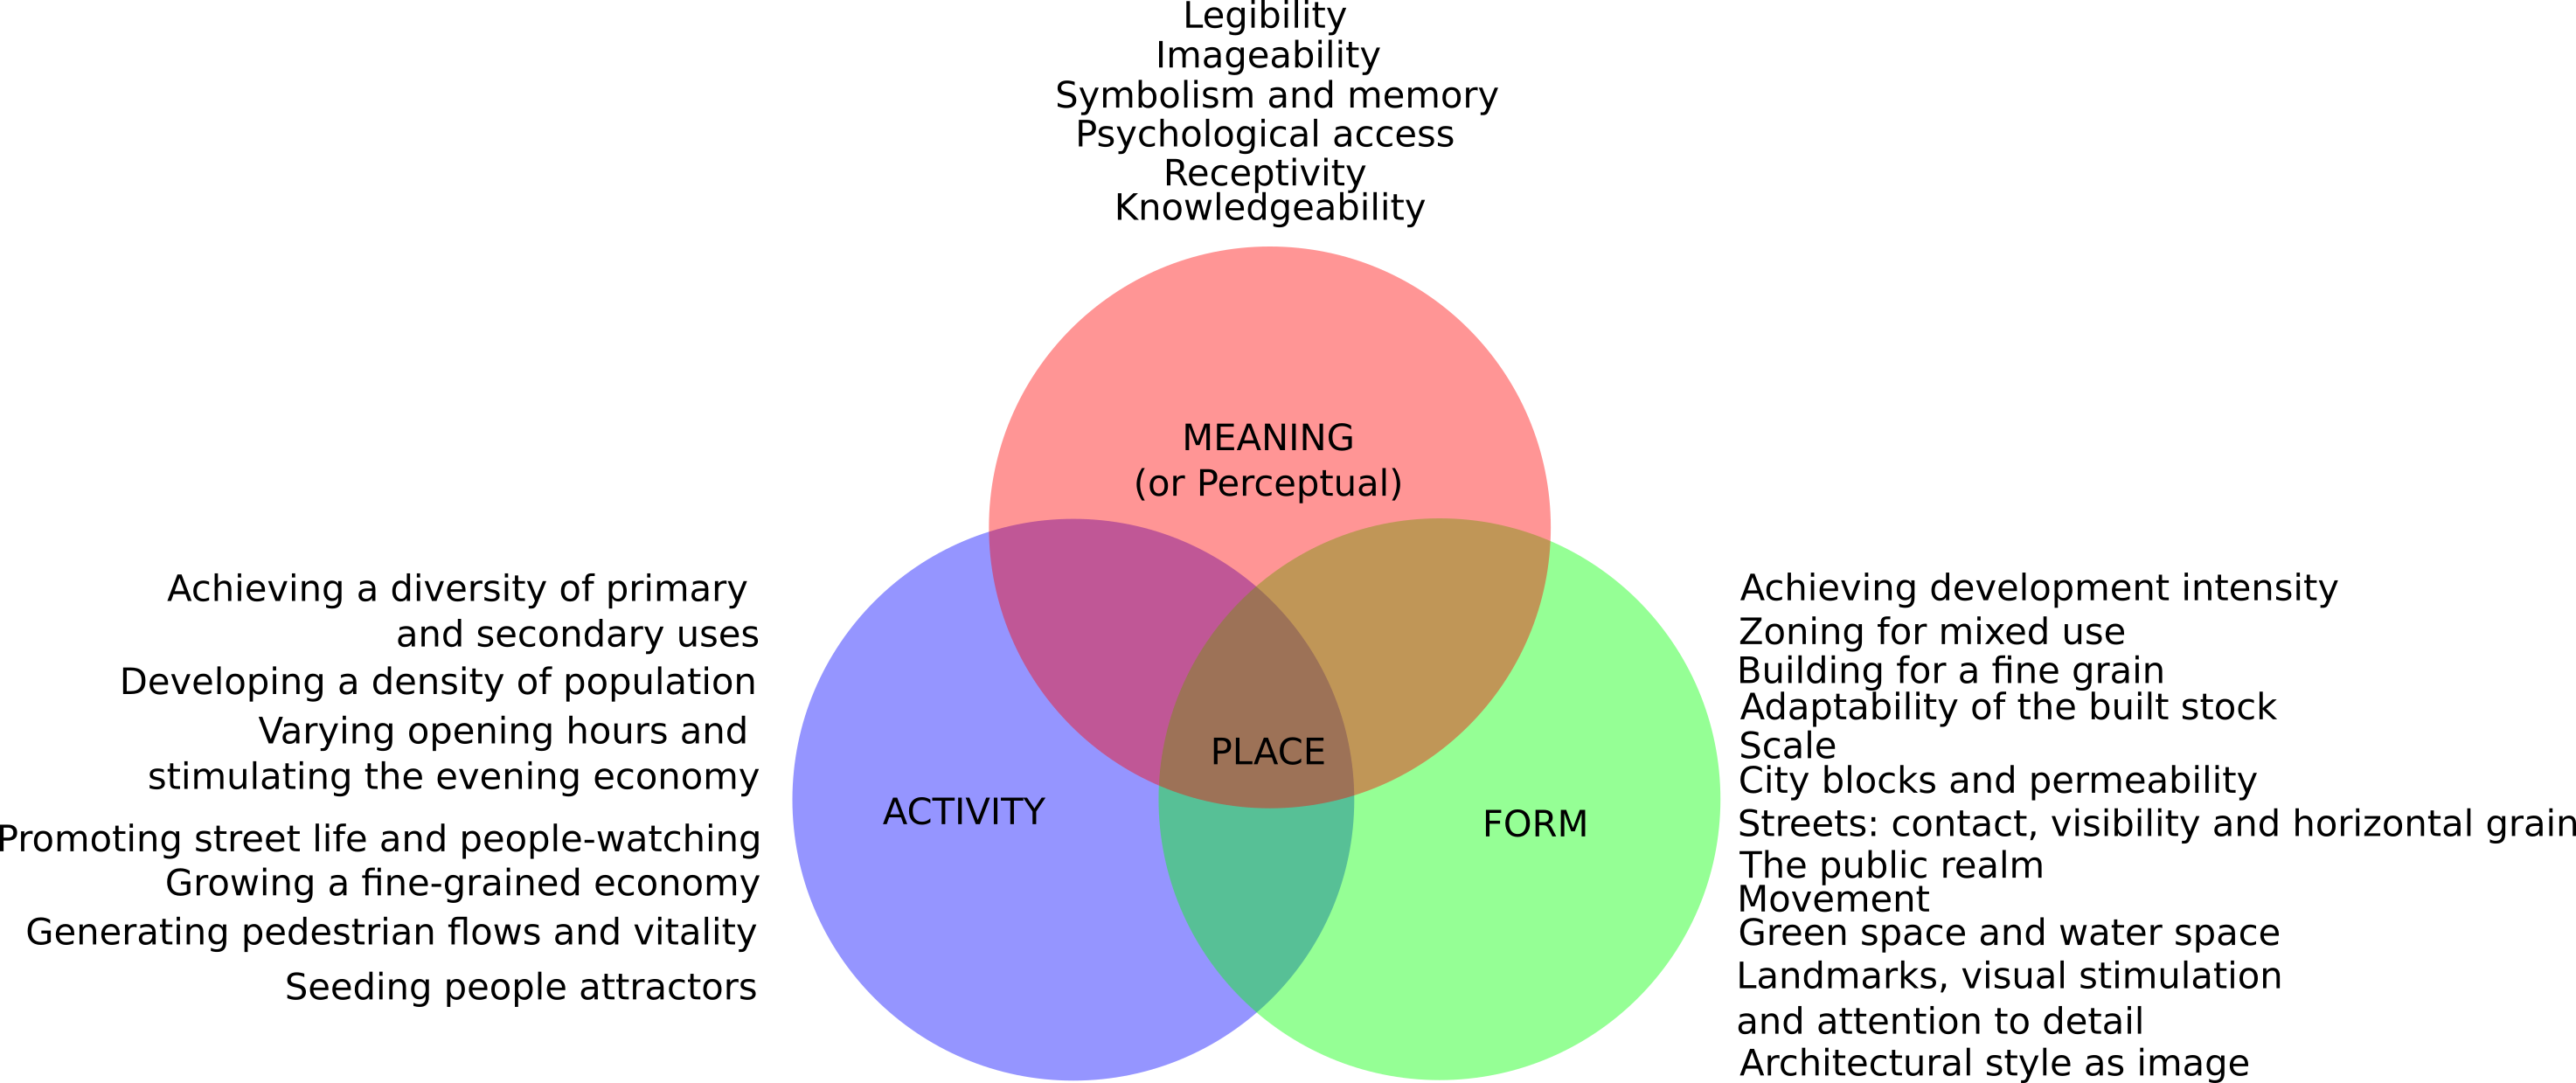
Figure 2.9: The sense of place, adapted from Punter and Carmona (1997) and Montgomery (1998)
Carmona (2021) posits that there are two overarching traditions within the field of urban design, each with its own distinct perspective on design and its outcomes. The first tradition, the “visual-artistic” approach, emphasises the aesthetic qualities of buildings and urban spaces. The second tradition, the “social usage” perspective, instead focuses on the social aspects of people, places, and activities within urban areas. These two traditions have gradually evolved into a third, more holistic perspective referred to as the “making places” approach, which brings together elements of the other two traditions (Carmona 2021).
As noted by Lew (2017), the term “place making” is spelled in multiple ways, acquiring multiple distinct meanings among those spellings. There is no clear pattern linking spelling and meaning of this concept. Therefore, the author makes a distinction between broader “place making” and narrower “place-making/placemaking”. The broader definition, “placemaking”, is what Montgomery (1998) defines as the “sense of place”. “Place making” represents how groups stamp values, perceptions, traditions, and memories on the natural and built environment, giving meaning to space (Montgomery 1998; Mowla 2004; Wortham-Galvin 2008). This definition includes both organic “place-making” and planned “placemaking”. Organic “place-making” is associated with bottom-up initiatives driven by individuals, local groups and agencies, representing spontaneous and unstructured civic approaches that categorise a particular space as a place. Unlike organic “place-making”, planned “placemaking” is associated with the government, developers, and sociopolitical structures through top-down initiatives. “Placemaking” is master-planned, involving multiple stakeholders including different experts (Placemaking Professionals, Cultural and Arts practitioners, Developers and Planners, Architects and Urbanists, Urban Designers, Academics and Researchers, Government, and Environmentalists) and communities (Residents, Local Business owners, Local workers, Event audiences, Tourists, Local Arts groups and organisations, non-profit organisations, and Educational Institutions) (Silberberg et al. 2013; Karndacharuk, Wilson, and Dunn 2016; Lew 2017; M. Cohen et al. 2018).
Carmona (2002) expanded the concept of placemaking into eight dimensions of urban design: Spatial, Morphological, Contextual, Visual, Perceptual, Social, Functional, and Sustainable, as Figure 2.10 illustrates.
Spatial: Refers to the arrangement and organisation of space, including the distribution of land uses, circulation patterns, and open spaces.
Morphological: Concerns the physical form and structure of the built environment, including the scale, massing, and typology of buildings.
Contextual: Relates to the relationship of the built environment to its surrounding context, including the natural and cultural heritage, and the historical and social context.
Visual: Pertains to the aesthetic and visual qualities of the built environment, including the composition, materiality, and colour of buildings and spaces.
Perceptual: Focuses on how the built environment is experienced by users, including issues of legibility, orientation, and accessibility.
Social: Considers the social and cultural dimensions of the built environment, including issues of inclusivity, social interaction, and community identity.
Functional: Addresses the practical and functional requirements of the built environment, including issues of accessibility, wayfinding, and adaptability.
Sustainable: Relates to the environmental impact of the built environment and the use of sustainable design principles, such as energy efficiency, resource conservation, and biodiversity.
Overall, these dimensions provide a comprehensive approach for designing urban spaces in a way that balances multiple concerns, including the physical form of the built environment, the social and cultural context, and the environmental sustainability.
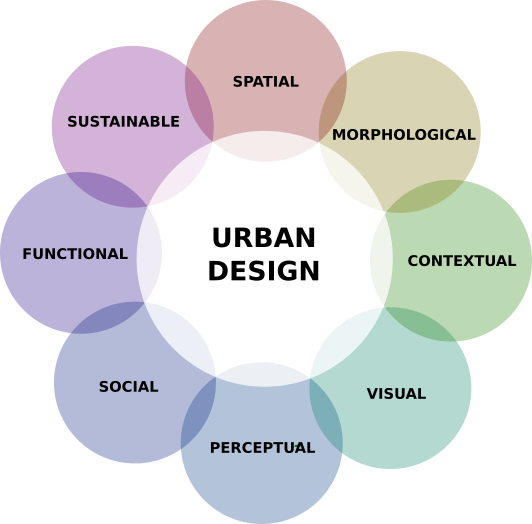
Figure 2.10: The eight dimensions of Urban Design adapted from Carmona (2002)
It has been suggested that the digitalisation of the world could potentially lead to degradation of the concept of place. However, the introduction of the internet in the “space of flows” (William J. Mitchell 1996), has had a significant impact on cities. Contrary to the predictions of theorists who believed that the internet would lead to the elimination of physical proximity, the internet and cities now exist in a state of productive collision where physical and virtual spaces are fused together. Both proximity and connectivity play important roles in this hybrid space (Ratti and Claudel 2016).
Recent shifts in societal expectations have led to a new, multifaceted understanding of space. This understanding highlights the fluidity and flexibility of the function of space, its users and residents, and the freedom of its form from functional constraints. As a result, space is no longer limited by traditional notions of usage, form, capacity, user, or physical form. Advanced technology has allowed urban designers and architects to analyse and study a building remotely, even before its construction, without the need for on-site presence. Mahmud Rezaei (2020) posits that in order to effectively incorporate this new understanding of space into the design process, it is essential to consider at least three key fields: cyber geography, which deals with digital networks and the representation of flows of space; cybernetics and systematic planning, which includes algorithmic approaches; and the planning of mediated spaces, which incorporates both virtual and non-virtual spaces within public open spaces (M. Rezaei 2004; Mahmud Rezaei 2020).
Summing up, these distinct manners of approaching the design activity show that there are multiple pathways to interpret and creating an understanding of the design practice. Besides that, the boundaries between these different manners of designing tend to blur whilst considering the subjective interpretation and singular approach that each designer carried based on their experience. This PhD proposes to create an understanding of the current practice of data-driven urban design processes, as a first objective to be achieved, as delineated in Chapter 1, considering urban design as a procedural design activity, and, by acknowledging that these multiple design interpretations, a solid theoretical background is created, assisting the next steps of this PhD, where semi-structured interviews are conducted to create a snapshot of current urban design practice that will guide the development of an approach to assisting data-driven urban design processes (as presented in Chapter 4).
2.3.2 Data-Driven Urban Design
In the design domain, the responsibility for urban development lies with urban designers (Carmona 2021). From the perspective of this study, Urban Design is a complex problem-solving process (Punter and Carmona 1997; Carmona 2021) that involves the management of multiple dimensions (Spatial, Morphological, Contextual, Visual, Perceptual, Social, Functional, and Sustainable) (Carmona 2002), as discussed in the previous section.
From this understanding, the urban design process, as a procedural design activity, is explored under the co-evolutionary nature of design problem-solution (Dorst and Cross 2001); wherein different interpretations and approaches can be valid for the same urban design problem (William J. Mitchell 1975; Cross et al. 1984; Dorst 2003). Recently, urban design has started to be explored through a data-driven design approach with the emergence of smart infrastructure, smart technologies, data science methods, and the availability of cities’ open data (Karakiewicz 2010; Deutsch 2015; Kvan 2020; Gösta et al. 2020). Designers are using computational tools and service platforms to assist the urban design process in data gathering, real-time analyses, alongside generation and visualisation of evidence-based design propositions (Picon 2015; Kvan 2020).
2.3.2.1 Data-Driven Design
For many years, professionals in the fields of architecture, engineering, and construction have utilised data as part of their work. However, what sets the current landscape apart is the plethora of methods now available for gathering, analysing, and utilising the data that is at our disposal (Deutsch 2015).
In recent years, the field of data science has gained increasing attention for its ability to extract knowledge, understanding, and insights from a variety of data sources. As a multidisciplinary field, data science draws upon a range of scientific disciplines including mathematics, statistics, information science, and computer science to achieve this goal (A. Liu, Wang, and Wang 2022).
The origins of data science can be traced back to the fields of statistics and computer science, with the development of early computer-based statistical and data analysis tools in the 1960s and 1970s (Dasu and Johnson 2003). However, it was not until the advent of big data and the increasing availability of large, complex data sets in the 21st century that the field of data science truly began to take shape (Hilbert and Lopez 2011).
One of the key characteristics of data science is the use of advanced analytical and computational techniques to extract insights from data. This includes the use of machine learning algorithms, statistical models, and visualisation techniques. Furthermore, data science also often involves the integration of domain-specific knowledge to ensure that the insights and predictions generated are relevant and meaningful (Leek and Peng 2015). Furthermore, data science offers the ability to communicate and present findings to both technical and non-technical audiences. This requires data scientists to possess strong communication and data visualisation skills, as well as the ability to translate complex technical concepts into easily understandable insights (Provost and Fawcett 2013).
In recent years, the field of data science has seen a significant increase in popularity, demanding additional data scientists and creating growing recognition of the value that can be derived from data-driven insights (Boyd and Crawford 2012). In the design field, data science has been used to provide evidence-based insights during the design process (A. Liu, Wang, and Wang 2022).
Data-driven design is emerging as an approach in the design process that utilises data to assist evidence-based design decisions. The data-driven design approach uses data collected from various sources, such as survey, open data, and sensor data, and smart city infrastructure, generating insights to inform decisions during the design process. The data-driven design approach aims to provide an evidence-based approach to the design process that leads to more effective and efficient decision-making.
Data-driven design seeks to explore new design spaces as well as optimise design solutions (W. Chen et al. 2019). Additionally, data-driven design supports the identification of patterns and trends that are not immediately apparent during the design process (Deutsch 2015; A. Liu, Wang, and Wang 2022). Furthermore, the benefits of using a data-driven design approach reside in the fact that designers can consider multiple scenarios, evaluating the best design solution based on the data collected, providing more effective and efficient decision-making.
2.3.2.2 Data-Driven Design in Architecture and Urban Design
In the field of architecture and urban design, data-driven design was firstly conceptualised as the use of real-time values sourced from the environment, users, and other relevant parties in the artistic or architectural production process (Bier and Knight 2014). Assumed values, such as formal and functional requirements, are also considered in the design process. The combination of real-time and assumed values shapes the conceptualisation and progression of design. This information and knowledge is then applied for various purposes, such as representation, generation, materialisation, and operational use (Bier and Knight 2014). An example of this conceptualisation can be seen in the work of Hensel and Sørensen (2014), which examines various computational strategies for data-driven design that assist in the generation and incorporation of design processes.
Some studies in data-driven design explore data-driven urban design processes in the context of simulating urban environment performance and placemaking. For example, Chokhachian et al. (2018) presented a novel methodology for evaluating outdoor comfort in the urban environment by measuring and assessing pedestrian responses, allowing an examination of the relationship between urban morphology and environmental factors. Mathers (2019) examined the potential of data-driven methods enhancing the resilience, equity, and flexibility of urban design. The study focused on exploring how urban data can influence understanding of human interactions with cities, specifically within the context of “placemaking”, providing an overview of various methods for incorporating data in evidence-based design decisions, as per cases in New South Wales, Australia. Chokhachian et al. (2020) conducted a study that employed a generative approach to establish a correlation between urban physical density and performative urban design. The research focused on examining the environmental implications of urban morphology, proposing a methodology to identify the most performative urban form, regarding potential urban heat islands, solar access, and daylight, for a specific Floor Area Ratio (FAR) value, which serves as a measure of urban density.
A study conducted by Ameijde (2022) investigates the potential of generative design in creating public spaces and environments. Through a series of theoretical and practical experiments conducted in the context of academic research and teaching, the study developed user-driven generative design processes based on the principles of “The Architecture Machine” by Nicholas Negroponte (1975b). The research examines how computational tools for site analysis and monitoring can enable data-driven urban place studies, and how these can be integrated with generative strategies across various scales. The study aims to explore the relationship between user-driven generative design and the implementation of computational tools in urban site analysis and monitoring. Additionally, this study is the first attempt to provide a more systematic approach to conduct data-driven urban design based on the concept of “architecture machines” and feedback loops from Negroponte (1975b) . The proposed process is divided into four stages: gathering, analysing, translating, and implementing, as per Figure 2.11.
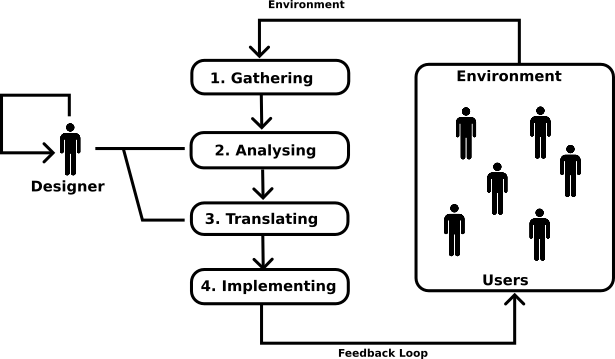
Figure 2.11: The Systematic Approach for Data-Driven Urban Design, adapted from Ameijde (2022)
In the field of engineering design, a framework for data-driven engineering design has been proposed by A. Liu, Wang, and Wang (2022). This framework defines a collaboration between design operations and data operations to accelerate, better inform, and rationalise engineering design processes. According to A. Liu, Wang, and Wang (2022), the process of data-driven design engineering involves the integration of established design methodologies, such as the scientific study of engineering design, with emerging data science techniques. This process is managed through collaboration between human designers and design machines.
The key benefit of data-driven design is that it allows organisations and individual stakeholders to make more informed decisions about the design and redesign of artefacts by utilising the growing volume of data available. This can be achieved using various data-based techniques, algorithms, technologies, and tools. The design methodologies are implemented in the framework as “design operations”, integrating with the data analytics processes, which are categorised as “data operations” through a “data-driven cycle”.
According to A. Liu, Wang, and Wang (2022), design operations are a structured and deliberate process aimed at exerting a positive influence on the design process, including the purpose, methods, and extent of design and redesign of an artefact, whether it be a product, process, or service. Several design procedures are proposed based on the three stages of engineering design processes: functional design, conceptual design, and technical design.
The functional engineering design stage: In this phase, various design operations are typically carried out, including obtaining input from customers, comprehending customer preferences, inferring customer needs, conducting comparative analyses, determining segmentation, targeting, and positioning, breaking down the design into functional parts, creating functional models, addressing design limitations, and establishing evaluation standards.
The conceptual engineering design stage: This phase includes a variety of design operations, such as generating ideas, defining the concepts, breaking them down into modular components, organising the concepts, evaluating the concepts, selecting a final concept, visualising the concept, refining the concept, evaluating feasibility, incorporating industrial design principles, and conducting preliminary design of individual components.
The technical design phase: This phase encompasses a variety of design operations, including analysing the design, developing detailed designs for individual components, conducting computational analysis, optimising the design, creating plans for production, creating rapid prototypes, simulating virtual prototypes, creating design drawings, creating a bill of materials, designing for specific considerations such as manufacturing, remanufacturing, sustainability, and recycling, conducting experimental design, and testing.
Regarding the “data-driven cycle” and “data procedures”, A. Liu, Wang, and Wang (2022) argue that a “data-driven cycle” is a series of stages that a dataset goes through from being raw data to becoming information, knowledge, and ultimately leading to more informed decisions. A data operation is a structured activity aimed at extracting information, knowledge, intelligence, and understanding from raw data. The “data-driven cycle” encompasses a variety of data operations, the specific combination of which may vary depending on the nature of the dataset. Common data operations include:
Data collection: The process of acquiring qualitative and quantitative data, which may involve a variety of methods, such as surveys, interviews, smart sensors, and observation.
Data transmission: The process of transmitting data across different devices, platforms, and users/organisations, ensuring that data is properly and securely transmitted from one point to another.
Data cleansing: The process of identifying, labelling, replacing, and removing irrelevant and incorrect data from a dataset, ensuring the accuracy and integrity of the data.
Data integration: The process of combining datasets collected from various sources and channels, creating a more comprehensive and holistic view of the data.
Data storage: The process of preserving acquired data for documentation, organisation, querying, and retrieval, ensuring the longevity and accessibility of the data.
Data analysis: The process of examining a given dataset to validate new hypotheses or uncover previously unknown patterns, extracting meaningful insights from the data.
Data mining: The process of identifying implicit, hidden, abnormal, and unknown patterns in a dataset, revealing previously unanticipated insights from the data.
Data visualisation: The graphical representation, organisation, and illustration of raw data, as well as the outcomes of data analysis and data mining, presenting the data in a more easily understandable format.
Data security refers to the process of protecting data from unauthorised access, typically through cyberattacks or other prohibited means. This step is critical for maintaining the confidentiality and integrity of the data.
Data Privacy pertains to how, to what degree, and in what manners confidential data produced through privately-owned devices or personalised services can be disclosed and scrutinised by external parties. It is a crucial measure in ensuring the protection of the privacy of individuals and entities.
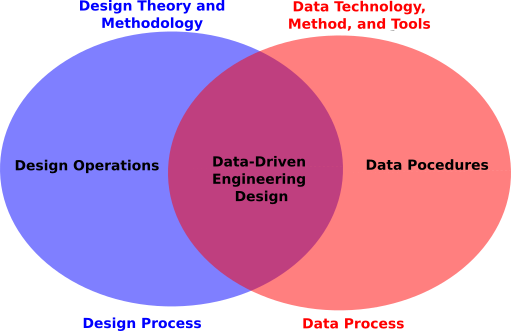
Figure 2.12: Data-Driven Engineering Design framework, adapted from A. Liu, Wang, and Wang (2022)
Although data-driven design is an emerging approach that is gaining momentum in practice and academia across multiple disciplines, particularly in architecture and urban design (Bier and Knight 2014; Hensel and Sørensen 2014; Deutsch 2015; Chokhachian et al. 2018, 2020; Mathers 2019; Ameijde 2022), there have been few attempts to systematise it in these fields in order to assist designers in navigating the design process, data operations across the data-driven cycle, and potential computational technologies. While similarities can be traced between engineering and design processes, it is crucial to have a systematic approach to data-driven design specific to architecture and urban design, as the problems addressed by these disciplines are distinct in nature, as discussed in Section 2.3.1, “tame” and “wicked” problems, respectively. Therefore, the steps, reasoning, and objectives behind the procedural logic that define these processes are distinct, as well as their relationships with the data and potential enabling technologies.
2.3.2.3 Data-Driven Urban Design and Enabling Computational Technologies
In the field of architecture and urban design, understanding how smart city infrastructure and technologies can contribute to urban design processes is an ongoing area of research. Further investigation is required to explore how these technologies can improve the prediction, diagnosis, description, and prescription of actions in relation to urban design dimensions. For example, how urban patterns affect people’s behaviour, social networks, and economic networks, as well as travel behaviour. Smart technologies, such as data mining, machine learning, and statistical methods, can be used to investigate these topics as alternatives to traditional data collection and analysis methods, which tend to be costly, infrequent, rapidly obsolete, incomplete, and inaccurate (Batty et al. 2012, 489).
Table 2.8 presents a description of some computational technologies found in the literature that have applications in relation to smart cities and data-driven urban design processes.
| Computational Technologies | Description | Smart Cities: Data-Driven Urban Design related works |
|---|---|---|
| Blockchain | Blockchain is a digital ledger technology that allows for the creation of tamper-proof and permanent records of transactions. It uses cryptography to ensure the integrity and chronological order of the recorded transactions, and it is decentralized and distributed across a network of computers. Each block in the chain contains a number of transactions and every time a new transaction is added to the block, it is added to the chain, creating a permanent and unchangeable record. The decentralized nature of the technology allows multiple parties to have access to the same information, reducing the need for intermediaries and increasing transparency (Nakamoto 2008). | (Oliveira, Oliver, and Ramalhinho 2020; Singh et al. 2022) |
| City Information Modelling (CIM) | City Information Modelling (CIM) refers to a digital representation of the physical and functional characteristics of a city. It allows for the integration and management of data from multiple sources, such as building information modelling (BIM), geographic information systems (GIS), and sensor networks. CIM enables the creation of a virtual city model that can be used for planning, design, construction, operation, and maintenance of the built environment. It also allows for collaboration, simulation, and analysis of the city’s performance, providing decision-makers with the necessary information for informed decision-making (Lee, Kim, and Park 2018). | (Beirão 2012; X. Xu et al. 2014; Z. Xu et al. 2021) |
| Crowdsensing | Crowdsensing refers to the process of collecting and analysing data from a large group of individuals or devices, typically through mobile devices, in order to gain insights and make decisions. It involves the participation of a crowd of volunteers or users who provide data through their mobile devices, such as GPS location, sensor readings, and user-generated content. The data is then analysed to extract valuable information that can be used to make decisions or to improve the performance of systems, services, and infrastructure(Ganti and Akoglu 2011). | (Zappatore, Longo, and Bochicchio 2017; Alvear et al. 2018) |
| Crowdsourcing | Crowdsourcing refers to the practice of obtaining needed services, ideas, or content by soliciting contributions from a group of people, particularly from the online community, rather than from traditional employees or suppliers. The concept of crowdsourcing is based on the idea of tapping into the collective intelligence and creativity of a large group of people, to achieve a specific goal or solve a problem, typically through an open call. The crowd can take the form of a community, a group of consumers or a network of experts, and they voluntarily provide their input, ideas, or services in response to a request or challenge (Howe 2006). | (Aljoufie and Tiwari 2022; Matarazzo et al. 2022) |
| Data Analytics | Data analytics is the process of examining, cleaning, transforming, and modelling data with the goal of discovering useful information, drawing conclusions, and supporting decision-making. It encompasses a wide range of techniques and methods, including statistical analysis, machine learning, data visualisation, and data mining, to extract insights and knowledge from structured and unstructured data. Data analytics can be applied to various fields, such as business, healthcare, finance, and science, to support the decision-making process and inform strategic planning (Inc 2017). | (Batty 2013b; Rathore et al. 2016; Silva et al. 2018; Miranda et al. 2021; Bartesaghi-Koc, Osmond, and Peters 2022) |
| Geometry Processing | Geometry processing is a field of computer science that deals with the representation, manipulation, and analysis of geometric data. It includes a wide range of techniques, such as mesh generation, mesh optimization, and mesh processing, that are used to represent and manipulate geometric shapes and models. Geometry processing is used in many applications, such as computer graphics, computer-aided design, and computer-aided manufacturing (Sorkine and Alexa 2007). | (Demir and Aliaga 2018; Salazar Miranda et al. 2021) |
| GIS | GIS, or Geographic Information Systems, is a technology that enables the capture, storage, manipulation, analysis, management, and presentation of spatial data. It allows for the visualisation and analysis of data in a geographic context, providing insights that are not possible with traditional data analysis methods. GIS is used in a wide range of applications, such as urban planning, natural resource management, and emergency response (Longley et al. 2001). | (Sinnott et al. 2012; Batty et al. 1998; Batty 2013b; Ratti and Claudel 2016) |
| IoT | The IoT, or Internet of Things, refers to the network of physical objects, devices, vehicles, buildings, and other items that are embedded with sensors, software, and connectivity, enabling them to collect and exchange data. IoT technology allows for the creation of smart environments and the automation of various processes, and it is used in a wide range of applications, such as smart homes, smart cities, and industrial automation (Atzori, Iera, and Morabito 2010). | (Rathore et al. 2016; Angelakis et al. 2016) |
| Immersive Technologies | Immersive technologies refer to a group of technologies that aim to replicate or simulate real-world environments, such as virtual reality (VR) and augmented reality (AR). These technologies provide users with a sense of immersion, allowing them to interact with virtual environments as if they were real. Immersive technologies are used in a wide range of applications, such as gaming, training, and education (Milgram and Kishino 1994). | (Jamei et al. 2017; Yagol et al. 2018; Kaji et al. 2018) |
| Machine Learning and Computer Vision | Machine learning (ML) is a field of artificial intelligence that involves the development of algorithms and statistical models that enable computers to learn from data and improve their performance on a given task without being explicitly programmed. ML techniques are used for a variety of applications such as natural language processing, computer vision, and predictive analytics. Computer vision is a field of study that focuses on the development of algorithms and models that enable computers to interpret and understand visual data from the world, such as images and videos. It is a key component of many machine learning systems, and it is applied in a wide range of applications such as image recognition, object detection and tracking, and self-driving cars (Goodfellow, Bengio, and Courville 2016). | (Vaz, Karakiewicz, and Kvan 2015; Baccouche et al. 2011; X. Li, Cai, and Ratti 2018; Ye et al. 2019; Weerdenburg et al. 2019; W. Qiu et al. 2021, 2022; Sun et al. 2022) |
| Sensing | Sensing refers to the process of measuring and collecting data from the physical environment using sensors. Sensors are devices that convert physical phenomena, such as light, temperature, sound, or motion, into electrical signals that can be processed by computers. Sensing technology is used in a wide range of applications such as environmental monitoring, industrial automation, and healthcare (Kahn 2002). | (Gabrys 2014; Harris et al. 2021) |
| Simulation | Simulation is the process of creating a model of a real-world system and using it to predict the behaviour of the system under different conditions. Simulation can be used to test the performance of a system, optimise its design, or train operators. It can be applied in various fields, such as engineering, finance, and healthcare. Simulation technology can be categorised into two types, namely, analytical and experimental simulation. Analytical simulation involves mathematical modelling of the system, while experimental simulation involves the physical or virtual replication of the system (Ross 2015). | (Kim et al. 2018; Bartesaghi-Koc et al. 2021) |
| Social Media Data Analytics | Social Media Data Analytics (SMDA) is the process of collecting, analysing, and interpreting data generated by social media platforms to extract insights and knowledge. The data can be in the form of text, images, videos, and other forms of user-generated content. SMDA helps organisations to understand user behaviour, sentiment, and preferences, and it can be used to inform strategic planning, marketing campaigns, and customer service (B. Liu 2018). | (N. C. Chen, Nagakura, and Larson 2016; Steentoft et al. 2018; Fu et al. 2018; Salazar-Miranda et al. 2022) |
| Spatial Data Analytics | Spatial Data Analytics (SDA) is the process of collecting, analysing, and interpreting data that has a geographic or spatial component. It allows for the visualisation and analysis of data in a geographic context, providing insights that are not possible with traditional data analysis methods. SDA is used in a wide range of applications, such as urban planning, natural resource management, and emergency response. SDA is particularly useful for understanding patterns, trends, and relationships in data, and it can be applied to various types of data, including satellite imagery, sensor data, and demographic data. GIS, or Geographic Information Systems, is a key component of SDA. It enables the capture, storage, manipulation, analysis, management, and presentation of spatial data (Peuquet and Duan 2010). | (Batty 2013b; Sevtsuk 2010; Schläpfer et al. 2016; Herthogs et al. 2018) |
| Wearables | Wearables are devices that can be worn on the body and are equipped with sensors, computing power, and connectivity, allowing them to collect and exchange data. Wearable technology is used in a wide range of applications, such as fitness tracking, medical monitoring, and augmented reality. Wearable devices can be in the form of smartwatches, fitness trackers, smart glasses, and clothing, among others (Chou and Chen 2015). | (Balsamo et al. 2017; Uddin et al. 2019) |
| Web Services | Web Services are a method of communication between different systems or applications over a network, typically the internet. It allows for the exchange of data and functionality between different systems, regardless of their underlying technology. Web services utilize standard protocols, such as HTTP and XML, to facilitate communication and data exchange. They are frequently used in various domains, such as business, science, and government, to provide interoperability and integration between systems. Web Services can be classified into two types: Simple Object Access Protocol (SOAP) and Representational State Transfer (REST). SOAP web services are based on the SOAP protocol and REST web services are based on the REST architectural style (Fernández and Llorens 2014). | (Sinnott et al. 2012; Wong, Jusuf, and Tan 2011; Pettit, Lieske, and Jamal 2017) |
The following paragraphs of this section will provide examples from the literature that have used computational technologies in the context of smart cities and data-driven urban design.
Weerdenburg et al. (2019) explored web data to determine whether a given type of leisure activity is available or not, using supervised multi-label machine learning strategies. The study discussed the potential for urban leisure, tourism research, and planning.
N. C. Chen, Nagakura, and Larson (2016) used data mining as a tool for evaluating a city, using Boston as a case study and utilising large-scale bottom-up data from social media sources such as Crunchbase, Twitter, Yelp, and Flickr. The data was mined across four innovation districts in Boston, with the study finding that the success of these districts was correlated with “mixed-use” areas.
Steentoft et al. (2018) borrowed the concept of “bio-indicators” from the ecology discipline and applied it to the urban context. The study sought to use an “indicator group” of people to assess the quality of a complex environment, tracking changes over time. Using the analysis of 92 million geolocated Twitter records across five US cities, the study classified groups with a “high-income-profile” as an indicator group, and visitation patterns as an indicator for the expected increase in rent in different neighbourhoods.
Fu et al. (2018) proposed a model for analysing geo-referenced Twitter data, with the goal of differentiating different activity types and identifying spatial-temporal patterns. The study demonstrated that deconstructing activity types using an NLP approach on tweet text can aid in uncovering detailed activity patterns in a city. It also showed that some tweeting activities, despite being carried out on the internet, are related to a geographical context.
Baccouche et al. (2011) proposed a fully automated deep learning model to classify human actions without using any prior knowledge. The method uses Convolutional Neural Networks to automatically learn spatial-temporal features and a Recurrent Neural Network to classify any sequence considering the temporal evolution previously trained for each time-step. The model used the KTH Dataset, which is the most used public human dataset, containing six types of actions (hand-waving, handclapping, running, boxing, walking, and jogging) performed among 25 subjects in four different scenarios, including indoor, outdoor, changes in clothing, and variations in scale. The model was evaluated with more than 90% accuracy on the test runs.
Vaz, Karakiewicz, and Kvan (2015) developed an algorithm model to represent how campus users interact with each other, seeking to comprehend how dynamics of activities are correlated with learning open spaces, exploring the hypothesis that outdoor public spaces contribute to learning activities.
Herthogs et al. (2018) presented a model, Visit Potential Model (VPM), to predict the presence of people in public spaces, combining a proposed universal law of visit frequencies in cities (Schläpfer et al. 2016) with a gravity measure for accessibility (Hansen 1959; Sevtsuk 2010), demonstrating how the model can be extended to represent the quality of public space, as well as liveliness throughout the day. This model aims to understand how urban form represents different patterns of human occupation and movement, linking those patterns to the qualitative concept of public space liveliness and walkability.
Personal comfort and behaviour concerning thermal conditions were explored by Kim et al. (2018), proposing a model which analyses occupants’ heating and cooling behaviour to predict individuals’ thermal preferences using six machine learning algorithms. The model provided a satisfactory understanding of the unique requirements of individuals with a median accuracy of 0.73 when compared with conventional comfort models.
Y. Xu et al. (2019) propose a computational framework that combines large-scale data on human mobility, social-network connections, and socio-economic status (SES) to provide a significant advancement in understanding the dynamics of spatio-temporal and social-network segregation in cities. The framework is based on a social similarity measure, and it enables researchers to depict segregation dynamics at the individual level, as well as provide aggregate measurements at the scale of places and cities and their evolution over time.
In a study by Salazar Miranda et al. (2021), a methodology is presented for analysing the morphological characteristics of informal settlements using terrestrial LiDAR data collected in Rocinha, the largest favela in Rio de Janeiro, Brazil. To evaluate the morphology of the informal settlement, the study proposes a set of five metrics that are related to the geometric properties of streets, including street width, street elevation, facade heterogeneity, facade density, and street canyon.
Miranda et al. (2021) present research that develops a desirability index for streets in Boston by utilising thousands of pedestrian trajectories obtained from GPS signals. The index is created by comparing the actual paths taken by pedestrians with the shortest path between any origin-destination pairs, and it reflects the willingness of pedestrians to deviate from their shortest path. The index also serves as a measure of the scenic and experiential value provided by different parts of the city. Additionally, the study employs computer vision techniques alongside geo-referenced data to analyse the built environment of streets, revealing that desirable streets generally have better access to public amenities such as parks, sidewalks, and urban furniture.
In a study by (W. Qiu et al. 2021), a methodology is proposed that combines crowdsourcing, computer vision (CV), and machine learning (ML) to subjectively measure four crucial perceptions suggested by classical urban design theory. The study collected ratings from experts on sample street view images (SVIs) regarding these four qualities, which served as the training labels. CV semantic segmentation is utilised to extract streetscape view indices as explanatory variables, and ML models are trained to achieve high accuracy in predicting scores. The research found a strong correlation between the predicted complexity score and the density of urban amenities and services points of interest (POI), which supports the validity of subjective measures.
Sun et al. (2022) present research that proposes a deep learning-based framework for understanding architectural styles and age epochs through the analysis of building facades using street-level imagery. The framework comprises two stages: Deep “Learning” of the architecture and Deep “Interpreting” of the architecture’s age, epochs and styles.
The presented studies have utilised data-driven techniques to explore and evaluate different aspects of urban design across multiple dimensions. The studies range from exploring leisure activities to street morphology and human behaviour in cities. They employ machine learning, data mining, and computational techniques to analyse data from social media, GPS, LiDAR, among other technologies, revealing correlations between the success of innovation districts and mixed-use areas, demonstrating how tweeting activities can be related to a geographical context, and providing insights into how outdoor public spaces contribute to learning activities. Additionally, the studies propose models to predict the presence of people in public spaces, understand dynamics of spatio-temporal and social-network segregation, and analyse the morphological characteristics of informal settlements.
Overall, these studies demonstrate the potential of a data-driven design approach and the use of a diverse range of computational technologies in exploring multiple dimensions of urban design. However, it also highlighted the diversity of technologies involved in the data-driven design process, requiring that designers have the know-how of dealing with multiple different software solutions that may not be seamlessly integrated. Besides that, the potentials of multiple technologies involved in the data-driven design process are not currently systematised and integrated into a design environment with which designers are familiar. Therefore, the integration of these technologies can enhance its accessibility beyond the academic circle, assisting data-driven designers to access the benefits of using these technologies in daily practice in a more user-friendly way, enhancing the current practice of evidence-based decisions.
2.3.3 Summary of Data-Driven Urban Design
This section presented an overview of theories of design to create understanding and to better support the distinctive modus operandi and motivations behind urban design processes. It has also been shown that, although data-driven design has been emerging and gaining momentum across multiple design disciplines, few attempts have been made to systematise it in order to assist designers during the process, highlighting the need for a systematisation that considers design process steps, data-driven cycles, and computational technologies in order to explore the multiple dimensions of urban design. Finally, this section has demonstrated the use and integration of a diverse range of computational technologies. Recently, with the popularisation of computational-based approaches among architects and urban designers (Caetano, Santos, and Leitão 2020), visual programming tools and other end-user programming strategies have become the preference of many researchers and practitioners, since they facilitate the integration of a diverse range of technologies through a user-friendly environment that tends to be less complex than textual scripting. This computational-based approach is discussed in the next section.
2.4 Computational Design and Toolmaking
This section provides an overview of the Computational Design field, as well as providing an understanding of the process of toolmaking in relation to Future Smart Cities.
2.4.1 Computational Design
According to Gero (1990), designers are agents of change in society. Designers engage in design with a purpose, and the design process is recognised as a special kind of problem-solving process (William J. Mitchell 1975), which involves “wicked” problems (Cross et al. 1984), due to some design variables being inversely proportional; for example, the control of illumination against the control of radiation in a room.
As discussed in Section 2.3.1, the design problem “underdetermination” and the iterative process combined offer a high degree of freedom and creativity for the designer during their introspective thinking. However, current mainstream design practice is often developed with strong subjectivity and the dominance of an intuitive process through sketch-based media, even with the generalisation of digitalisation in the offices and ateliers of design that started at the beginning of the 1990s (Oxman 2006). Current design practice typically uses computers to design as a literal translation of the paper-based design process to the computer screen, rather than exploring the computer’s power in doing calculations (Terzidis 2006). However, currently, this scenario has started to shift into one in which the design process is ruled by a data-driven perspective, due to the advancement of Computational Design and the emergence of Parametric Design Thinking into design practice (Oxman 2017).
Computational Design is a field that has been explored since the 1960s, with seminal writings in the 1970s (Eastman 1973; William J. Mitchell 1975; Negroponte 1975a). It represents a systematic methodology that aims to automate and make explicit the steps of the design process (Gu, Yu, and Behbahani 2018). This way of thinking became more popular with the emergence of script languages embodied in Computer-aided-design (CAD) and Building Information Modelling (BIM) software, such as Rhino 3D, and Revit, which are based on visual editors of algorithms, such as Grasshopper, and Dynamo. These platforms empower designers to create scripts in a more user-friendly way, and to explore not just one unique solution to a design problem, but an entire family of possible solutions that are based on the same principles and design rules (Burry 2011).
Parametric design thinking allows designers to adapt designs according to changing contexts (Oxman and Gu 2015). It is based on an associative data/geometry, in which design elements are interrelated in their functions and correlated to different kinds of data, such as text, image, and numbers, among other possibilities. Designers can define rules, logical and mathematical associations, creating relationships between design elements.
Moreover, computational design models include performance-based models (Oxman 2006) as part of the process of looking for a design solution that is driven by a requested performance (Kolarevic and Malkawi 2005; Oxman 2006, 2017). There are several visual programming extension tools that support a performance-based way of thinking through parametric design. Each performance-based “plug-in” addresses a specific subfield belonging to the design practice, for example, Ladybug and Honeybee for Sustainable Environmental Design, Karamba for Structural Design, Kangaroo for Form-finding with Computational Physics, and Archsim for Energy Modelling, among others.
Urban design, as a problem-solving design practice (Cross 2011), has its own dedicated set of tools in parametric design platforms. There is an emergence of performance-based plug-ins related to the field of urban design and planning, such as Urbano for urban mobility and activity, Dragonfly for environmental urban design simulations, and Numerical Urban Utility for urban mobility and land-use tools for Grasshopper.
However, as identified in the literature review, data-driven urban design strategies that consider an holistic view of smart cities’ development, which includes a comprehensive understanding of multiple urban design dimensions (such as people’s behaviour, economic aspects, environmental conditions, people’s perception, social aspects, and spatial configuration) to inform evidence-based decisions, needs further investigation. Despite parametric design tools offering an ideal scenario to integrate different datasets, most of the work undertaken by architects and urban designers using parametric tools is related to unidimensional perspectives of the field while addressing design problems. Studies investigating the integration of multiple datasets to inform evidence-based decisions in data-driven urban design processes are needed in the computational design field to enhance design practice and move towards an holistic understanding of urban issues. Additionally, as urban designers and architects start to become the users and developers of their own tools (Ceccato 1999; Burry 2011), a more holistic understanding of the social-political implications of tool development and use is also needed. The next section discusses the digital toolmaking process among architects and urban designers and its social-political implications under a more holistic view of smart cities’ development.
2.4.2 Designers as Toolmakers
McLuhan believed that human beings have a reciprocal relationship with their tools and technologies. He argued that humans shape their tools to suit their needs, but in turn, these tools shape the way humans think, perceive, and interact with the world. McLuhan’s theory of “media ecology” emphasises that media and technologies are not neutral but, rather, they actively shape our experiences and understandings of the world (McLuhan 1964).
Following similar reasoning, Baber (2003) argues that tools can be understood as physical objects that are utilised by users in a way that allows them to not only bring about changes in the surrounding environment, but also to serve as an extension of the users themselves. Baber suggests that tools are not created through a single, deliberate design process, but rather, they evolve gradually over time (Baber 2003).
McLuhan (1964) and Baber (2003)‘s arguments provide support for Frazer’s (1995) concerns about commercial computer-aided computational tools that “never quite seem to do what one wants in the way that one wants” (Frazer 1995.p23), since these commercial tools are often based on a market profit logic that is not tailored to the worldviews, desires, and expected outcomes of designers. Additionally, they tend to be designed as closed software ecosystems that are meant to fit all purposes and not as an evolutionary process that is gradually directed according to feedback, and users’ demands. This unsatisfactory scenario has pushed architects and urban designers to develop their own tools. This shift in the relationship between designers and tool developers has caused, which Ceccato (1999), Fischer (2003), and Burry (2011) to propose that designers should be seen as “digital toolmakers”. This scenario is an increasing trend among practice-based architects and urban designers since the boom of digital design in the 1990s (Oxman 2006) and has been facilitated through the popularisation of visual programming languages since the late 2000s. The following paragraphs provide some examples of background historical information about the use of scripting in academia.
2.4.2.1 Scripting
A seminal book about scripting in the context of architecture and design, “The Art of Computer Graphics Programming: A Structured Introduction for Architects and Designers”, written by William John Mitchell, Liggett, and Kvan (1987), explores a step-by-step practical approach to introduce computer graphics and computation to design professionals. The book explains mathematical concepts of geometry and their relationship with computer graphics and computation, such as how to draw geometrical forms, their representation on the screen, and the algorithms used to produce them. The examples in the book are implemented using scripting in the Pascal5 programming language.
This book is important as it introduces programming techniques alongside computational design concepts such as form exploration, parametrisation of shapes, symmetry and repetition, conditional and transformation operations, and encapsulation of shapes. The scripting exercises are always examples that establish a relationship with architectural elements, which validates the concepts as design generation strategies (Alencar and Celani 2013).
Frazer’s (1995) “An Evolutionary Architecture” is inspired by evolutionary principles from nature and makes an analogy between the design and evolution in its logic of a “living” process. The book is heavily influenced by theories of cybernetics, complexity, and chaos (Frazer 1995). Frazer uses an evolutionary approach as the foundation of his teaching program for the AA Diploma Unit II. The book documents the unit’s focus on the connection between computers and architecture, specifically examining how machine intelligence can be integrated into the design of built forms. The author delves into the idea of using architectural concepts, such as genetic language and scripting, as instructions for creating form. Additionally, the principles of morphogenesis, replication, genetic coding, mutation, and selection are all integrated into this approach. While the book does not present practical exercises in scripting, it provides a comprehensive examination of the intersection between evolutionary theory and architecture, presenting evolutionary concepts and their implications for computational design.
Ceccato (1999) presents the idea of designers as toolmakers, as well as two design experiments. The first experiment, “Metabolic Growth” (1995), explores a hierarchical growth form based on a cellular automaton script. A cellular automaton is a mathematical model consisting of a regular grid of cells, each of which can be in one of a finite number of states, with rules determining the state of each cell based on the states of its neighbours (Wolfram 2002). The second experiment, “Mendel” (1997), is a tool that explores the concept of genetic algorithms in form creation through breeding and natural selection and can also be used for performance-oriented goals (Ceccato 1999). According to Goldberg (1989), a genetic algorithm is an optimisation technique that uses principles of natural selection and genetics to evolve solutions to a given problem, through selection, crossover, and mutation operations.
Terzidis (2006) in “Algorithm Architecture” provides a comprehensive introduction to the concepts and techniques used in algorithmic design and demonstrates how they can be applied to generate form, layout, and organisation in architectural design. The author presents numerous case studies, using scripts (MEL, a script language developed for AutoDesk Maya) and examples of algorithmic design in architecture, including buildings, urban design, and landscape design. In 2009, Terzidis published another book, “Algorithms for Visual Design Using the Processing Language” (Terzidis 2009). This book explores a diverse range of concepts of two and three-dimensional form generation using scripts developed through the Processing6 language and script environment.
In his book “Programming.Architecture” (Coates 2010), Coates adopts a system’s perspective in which space and form are modelled using algorithms such as cellular automata, swarms, reaction-diffusion systems, and evolutionary algorithms. The concept of “self-organising morphologies” is central to the book, with the idea that form and spatial organisation can be understood through the phenomenon of emergence. The book examines the process of creating forms and spatial organisation through the lens of these self-organising algorithms, creating the scripts using programming languages such as AutoLISP, BASIC7, and pseudocode.
Robert Woodbury’s book “Elements of Parametric Design” (Woodbury 2010) offers a thorough examination of the application of parametric design in architecture. The book introduces the fundamental principles of parametric design, including the use of algorithms and scripting, to enable designers to effectively utilise parameters in their work. The book brings together the fundamental concepts of parametric systems with the basic concepts of geometry and computer programming. To illustrate the concepts, the book includes script examples created using Bentley Generative Components.
In “Scripting Cultures” (Burry 2011), Burry provides an holistic understanding of the practice of scripting in architecture, exploring both its technical and cultural implications. The book discusses the value of scripting in both education and practice as a process that supports creativity and variety in design space exploration. Additionally, the book delves into the idea that automating routine and repetitive aspects of the design process through scripting can liberate designers to spend more time on design thinking. The book explains that by modifying software through scripting, a range of possibilities opens that would not be available if the software were used solely as intended by the manufacturer.
Recently, there has been a rise in the use of visual programming languages over textual scripting approaches (Leitão, Santos, and Lopes 2012; Celani and Vaz 2012; Giuseppe Gallo, Wirz, and Tuzzolino 2019). Visual programming languages, also referred to as “diagrammatic programming”, enable users to create programs by assembling program elements visually rather than through typing code. These languages utilise an analogue, as opposed to a symbolic representation of entities (William J. Mitchell 1975). The key features of visual programming languages include the utilisation of a “box-and-wire” visual language, the hierarchical organisation of elements that can be grouped to form subunits, and the ability to type code in specific designated components (Celani and Vaz 2012). The rise of visual programming languages can be attributed to their more user-friendly learning curve compared with textual programming languages (Leitão, Santos, and Lopes 2012). However, Leitão, Santos, and Lopes (2012) argue that advancements in modern textual languages such as Python8, Haskell9, and Scheme10 have introduced features that simplify the scripting process. The next paragraphs provide a brief overview of visual programming languages in the context of computational design.
- Generative Components
Generative Components, a parametric CAD software developed by Bentley Systems, was first introduced in 2003. It saw a rising popularity in practice, particularly within the London architectural community, by early 2005. The software allows users to interact with it through dynamic modelling and direct manipulation of geometry, application of rules and capturing of relationships among model elements, or by defining complex forms and systems through concise algorithms. The software has a published API and utilises a simple scripting language, both of which enable integration with various software tools and the creation of custom programs by users.
- Grasshopper
Grasshopper is a visual programming language and platform that operates within the Rhinoceros 3D computer-aided design (CAD) application. The initial version of Grasshopper, then referred to as Explicit History, was released in September 2007. It has since become an integral part of the standard Rhino tool set in Rhino 6.0 and subsequent versions. Grasshopper allows for the dragging and placement of components onto a canvas, providing an intuitive way to explore designs without the need for learning textual scripting. This visual programming language has gained significant popularity among architects and designers, thanks to its strong community and the growing number of plugins (currently 65211) developed by its community.
- Dynamo
Dynamo is a visual programming tool that caters to both non-programmers and programmers. It enables users to script behaviour visually, define custom logic, and script using various textual programming languages. It also grants designers access to the Revit API (Application Programming Interface). The software is designed to interact with Revit for computational building information modelling (BIM) and can not operate as a standalone product. The developers of Dynamo assert that it does not require prior programming experience, making it accessible for users of all skill levels.
- Sverchok
Sverchok is a Free and Open-Source Visual Programming tool for Blender that aids in the generation of complex 3D shapes using a node system to control the flow of mathematics and geometry. It boasts a vast collection of modules, classes, and functions that allow for the manipulation of data structures, meshes, basic geometric objects, curves, and surfaces (including NURBS), fields, and solids. These methods are used internally by Sverchok nodes, but they can also be utilised by developers to create scripted nodes and add-ons that extend the functionality of Sverchok.
Even though visual programming languages facilitate the exploratory process of creating scripts, textual programming languages have been shown to be more efficient in cases involving large scale and complex tasks (Celani and Vaz 2012; Leitão, Santos, and Lopes 2012). According to Celani and Vaz (2012), a comparison of the use of textual and visual programming languages in architectural education found that visual programming languages may lead to better outcomes for novice architecture students. However, without a background in textual programming, the application is limited to parametric exploration. In contrast, scripting languages enable the development of more advanced generative design strategies, including the recursive application of rules, and they can be integrated with visual programming elements to provide a more interactive experience and real-time results (Celani and Vaz 2012). The integration between textual and visual programming languages in the context of computational design is necessary for an effective and holistic approach. Furthermore, without textual programming languages, the extensibility, and potential for modification of algorithms, or, in other words, their “hackability”, according to specific demands of the designer, is a barrier. This becomes an even bigger concern in the case of proprietary software, since restrictions and limits of modification are defined by the company that produces the software. The next section discusses the sociopolitical implications of the process of toolmaking in relation to future smart cities.
2.4.3 Digital Toolmaking and “The Right to the Future Smart Cities”
As discussed in previous sections, designers have been exploring data-driven approaches with the advent of smart infrastructure, data science methods, and the increasing availability of open data. Additionally, designers have been producing their own tools through computational design methods and scripting to address complex and specific design tasks. These tools have been shaped to address urban design issues and create narratives that have an impact on the development of future cities. In this context, this section explores the potential sociopolitical implications of the use and development of these tools.
2.4.3.1 “The Right to the City” as “The Right to the Future Smart Cities”
In his work, “The Right to the City”, Lefebvre (1967) argues that the right to the city is a fundamental human right, not just about access to physical space, but also about the ability to shape and reshape that space to meet the needs of its inhabitants. He contends that the right to the city is a collective right that is essential for the full realisation of human potential and for the creation of truly liveable and sustainable urban environments. He criticises the current modus operandi of urbanisation as a process that is driven by economic and political forces that prioritise profit over people.
In the context of future smart cities, in which big tech companies are directly or indirectly involved in the development of cutting-edge technologies and infrastructure that have a significant impact on how we experience the city, both physically and virtually, the role of digital toolmakers in reflecting on the benefits of developing tools to positively impact urban development is crucial. The question of what role citizens should play, whether as passive consumers or potential collaborators, is also important to consider.
For example, the smartphone apps industry that has emerged in the last 15 years has completely changed our relationship with the use and experience of our public and private lives. Offenhuber and Ratti (2014) argues that the advent of social media has facilitated the emergence of novel forms of participation and civic engagement. In addition to conventional forms of involvement in planning projects, citizens are now taking on more sophisticated roles in the monitoring, management, and administration of the city and its associated infrastructure, on a voluntary basis. On the other hand, social media has also been used recently by political forces as a manipulative weapon to spread misinformation to susceptible people (Shu et al. 2017) or for making a profit for big-tech companies by selling personal and sensitive data to third-party companies (Khan et al. 2020). The use and development of technology without a socio-political position is a double-edged sword; therefore, transparency, public participation, and awareness of the use and development of technological tools is critical for the development of future smart cities in which the social dimension of the space is considered, and technological advancements are not neglected, as well as to provide a middle ground between top-down and bottom-up approaches in each feedback loop across governance, designers, and citizens collaborating in shaping the future.
Ratti and Claudel (2016) advocate for the concept of “Futurecraft” as a systematic exploration of possible futures in which the smart infrastructure and computational technologies (Senseable Cities, in their words) can be explored through design in an interface between people, technology, and the city. As computing becomes more prevalent in urban environments, the interaction between physical and digital spaces is becoming increasingly important. This convergence may lead to the emergence of a new form of citizenship, in which citizens could participate in collective action, shaping the surrounding spaces. The city of the future is likely to derive from collaborative efforts between the digital and physical worlds, through which individuals and groups can actively shape and craft their surroundings: a collaborative “Futurecraft” (Ratti and Claudel 2016).
Ratti and Claudel (2016) argue that for a smart and liveable city to flourish, open data platforms and services are essential as they are the equivalent of accessible and open public spaces in traditional cities. The process of urbanisation is fundamentally political and can only be achieved through a combination of top-down and bottom-up approaches. Place-based application program interfaces (APIs) or data repositories may serve as new forums for the spread of ideas, critiques of standard practices, and expressions of socio-political views. The authors believe that the tools that enable the opening of cities can bring to fruition the long-held vision of co-creation in the urban environment, recognising that the built environment is a product of socio-environmental processes, and proposing “Futurecraft” as a mechanism that allows for the transformation of social processes into spatial products (Lefebvre 1967). Ultimately, the democratisation of “The Right to the City” as “The Right to the Smart Cities”, depending on the formation of a broad social movement to advocate for it, will enable communities to regain control and institute new modes of urbanisation.
2.4.3.2 Free Software
The vision of a feedback loop of collaboration between citizens, governance, and toolmaking regarding the development of new tools is only possible through the use of Free and Open-Source Software (FOSS), since proprietary software restricts users’ freedom regarding use, copying, and sharing of its binary and source codes (Stallman 2002). The Free and Open-Source movement, also known as Open Source or FOSS, refers to the philosophy and practice of freely sharing and distributing the source code and other intellectual property related to software and other digital products (Y. Qiu 2017). It is based on the idea that knowledge should be freely accessible and modifiable by anyone, rather than being controlled by a small group of individuals or corporations. The movement has its roots in the hacker culture of the 1960s and 1970s and was formalised with the launch of the Free Software Foundation in 1985 (Stallman 1985). One of the core principles of the Free and Open-Source movement is the concept of “copyleft”, which stipulates that any derivative works must also be made available under the same open license. This contrasts with traditional “copyright” laws, which grant exclusive rights to the copyright holder (Stallman 2002).
The Free and Open-Source movement is based on four core principles (Stallman 2002):
- The freedom to run the software, for any purpose;
- The freedom to study and adapt the software for one’s own needs;
- The freedom to redistribute the software;
- The freedom to improve the software and to release these improvements for the community.
The Free and Open-Source movement has been influential in the development of many widely-used software products, such as the Linux operating system, the Apache web server, and the Firefox web browser. It has also been credited with fostering innovation and collaboration in the software development community and with providing an alternative to proprietary, closed-source software.
2.4.4 Summary of Computational Design and Toolmaking
This section discussed that, although designers have become increasingly digital toolmakers, the benefits of desirable “hackability” fostered by the integration of textual and visual programming, and their feedback loops within society, are limited by the licence agreements of proprietary closed-source software. Trends show that designers tend to use proprietary software to develop these tools (Giorgio Gallo and Pallottino 1988) instead of Free and Open-Source solutions. Consequently, a more holistic understanding of the use and development of tools that tackle data-driven urban design problems is needed, considering their socio-political dimensions and implications for a vision of future “smart” cities.
2.5 Conclusion
In this chapter, the theoretical background of existing research on Smart Cities Development, Data-Driven Urban Design, and Computational Design and Toolmaking was reviewed critically. From this review, two critical gaps emerged, shaping the direction for this research:
There is a lack of systematisation of computational data-driven tools in relation to design processes, data procedures, and computational technologies, as well as integrative approaches across multiple urban design dimensions.
Current available data-driven tools and toolmaking processes tend to utilise proprietary software, which restricts technological use, community development, and sharing of improvements to a broader audience of potential users and developers. Therefore, a more holistic understanding of the use and development of tools that tackle data-driven urban design problems is needed, considering their socio-political dimensions and implications for a vision of Future “Smart” Cities.
Therefore, there is a need to bridge the gaps in the lack of systematisation and holistic understanding of the toolmaking process for data-driven urban design tools, proposing an integrated data-driven approach to assist urban design processes. The next chapter presents the research design for this thesis.
Sydney Dashboard: http://citydashboard.be.unsw.edu.au/↩︎
Melbourne: http://dashboard.melbourne.vic.gov.au/↩︎
A Free and Open Source Compiler Implementation of Pascal “Free Pascal”: https://www.freepascal.org/↩︎
Processing: https://processing.org/↩︎
A Free and Open Source Implementation of BASIC - FreeBASIC: https://www.freebasic.net/↩︎
Haskell: https://www.haskell.org/↩︎
Scheme: https://www.scheme.org/↩︎
This number was checked in the food4rhino repository that aggregates Grasshopper Plugins: https//www.food4rhino.com/en↩︎