3 Research Design
3.1 Introduction
As presented in Chapter 1, this research aims to develop, demonstrate, and validate an integrated data-driven approach to assisting computational urban design processes. Therefore, this chapter presents the research rationale, methodology, research phases and methods adopted to achieve this goal.
This chapter is organised in five sections: Section 3.1 introduces the chapter, Section 3.2 presents the research design rationale that guided the conduct of this research; Section 3.3 describes the methodology adopted and how it is applied in this research; Section 3.4 describes the research phases and the methods implemented; and Section 3.5 concludes the chapter, highlighting the methodological design.
3.2 Research Design Rationale
As discussed in Chapter 2, even though the current scenario of the emergence of smart infrastructure, data science methods, and availability of cities’ open data is propitious for a data-driven urban design approach to be explored, there is a lack of systematisation in the use of computational data-driven tools, regarding their relationships with design processes, data-driven cycles, and computational technologies as well as integrative approaches across multiple urban design dimensions. Also, the current available data-driven tools and toolmaking developments tend to utilise proprietary pieces of software, which restricts technological use, community development, and sharing of improvements to a broader audience of potential users and developers. Consequently, there is a lacking of options of free and open-source data-driven urban design tools that allow community-based software development, which is an essential feature for empowering citizens as active users of technological change and development and decision-making of future smart cities (Stallman 2002; Busch 2014; Sadoway, Shekhar, et al. 2014; Hernàndez 2021). This research seeks to bridge this gap by developing an integrated data-driven approach to assisting computational urban design processes. Figure 3.1 illustrates the research design rationale.
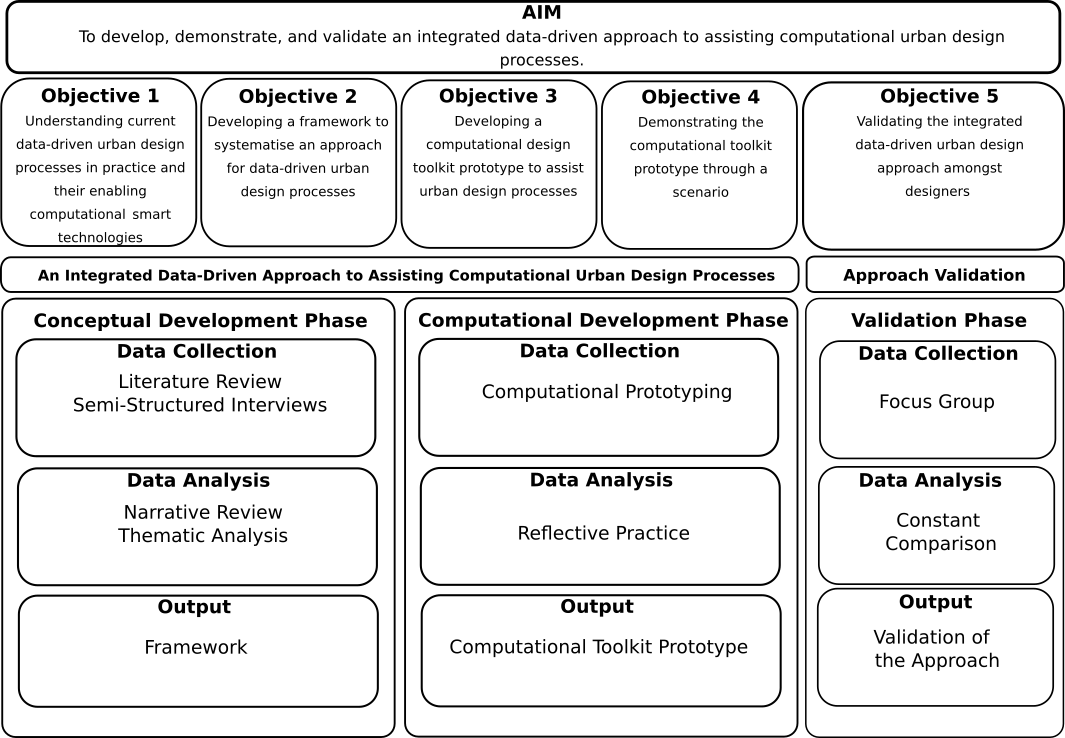
Figure 3.1: Research Design Rationale
Hofler (1983) defines the concept of an “approach” as a way of addressing a problem in a field, originating from a set of assumptions collected from different theories, concepts, and processes. The proposed approach was developed and validated in three phases: the first phase, conceptual development, consists of a framework; the second phase, a computational development, consists of a computational toolkit prototype; finally, the third phase is the validation of the approach, as Figure 3.1 shows.
In the first phase, Objectives 1 and 2 are achieved, which are, respectively: “Understanding current data-driven urban design in practice and its enabling computational smart technologies”, and “Developing a framework to systematise an approach for data-driven urban design processes”. To achieve these objectives, first a literature review is conducted to build upon theories, concepts, and processes regarding design processes (Gero 1990; Gero and Kannengiesser 2004; Yu, Gu, and Ostwald 2021), data-driven cycles (Deutsch 2015; Mathers 2019; Runkler 2020; A. Liu, Wang, and Wang 2022), and computational tools (Maguire 1991; Alonso et al. 2004; Botsch et al. 2010; Grekousis 2020; Runkler 2020; Dieck, Jung, and Loureiro 2021; Byerly, Kalganova, and Ott 2022). The narrative analysis of the literature review provides a comprehensive and contextualised overview that shaped the research questions, as well as providing a fundamental theoretical background that supported and guided the realisation of subsequent steps of the conceptual development. Second, to understand further the current scenario and demands of the practice of the data-driven urban design as well as its similarities and dissimilarities with traditional urban design processes, a snapshot of current urban design practice was documented through a set of semi-structured interviews with traditional and data-driven designers, seeking to complement, guide, and direct the framework development. Thematic analysis was used to identify key themes and patterns across the literature review concepts and empirical data from the interviews through a deductive approach, shaping the developed framework. The framework seeks to provide systematisation of the design processes, data-driven cycles, and computational technologies in a data-driven design context.
In the second phase, Objectives 3 and 4 are achieved, which are, respectively: “Developing a computational design toolkit prototype to assist urban design processes” and “Demonstrating the computational toolkit prototype through a scenario”. To achieve these objectives, a computational toolkit prototype is built upon the framework, comprising elements from both theory and practice. The development of the computational toolkit prototype intended to demonstrate the approach’s feasibility as a computational implementation of the approach. The prototyping is developed through a reflective practice, in which the product generated, the process of its creation, and the knowledge produced from its reflection cannot be disassociated.
Finally, in the third phase, Objective 5, “Validating the integrated data-driven urban design approach among designers” is achieved. To achieve this objective, a scenario is demonstrated through a focus group comprising traditional designers and data-driven designers, in order to demonstrate the potential usability of the created computational toolkit and validate the approach feasibility. The results of the focus group were analysed qualitatively using constant comparison, identifying common themes and patterns across the two groups of participants.
3.3 Design Science Research
This research is scoped under a pragmatic epistemology of Design Science Research (DSR). The DSR is a methodological approach in which the production of scientific knowledge involves the development of innovative artefacts that seek to solve real world problems from a specific domain, which must be assessed against their value or utility (Dresh, Pacheco, and Valle 2015). According to Dresh, Pacheco, and Valle (2015), DSR is the most suitable research methodology when objectives seek to design and develop, instead of describing, exploring, or explaining a phenomenon. The main aim of a DSR research project resides in designing an artefact that contributes to the production of knowledge (Peffers et al. 2007).
The DSR methodology is suitable for this research, since it proposes the development of an approach that seeks to address a practical problem for data-driven urban designers, regarding the integration of data and design tools as well as multiple datasets in a cohesive data-driven design environment. Also, this approach is composed of two research artefacts, a conceptual framework for data-driven urban design processes and a computational toolkit prototype as an implementation of the framework.
A cohesive body of authors (Baskerville, Pries-Heje, and Venable 2009; Alturki, Gable, and Bandara 2011; Van Aken and Romme 2012; Dresh, Pacheco, and Valle 2015) have proposed similar methods for conducting DSR research. The DSR methodology and its relationship to this research can be summarised in six main steps (Peffers et al. 2007):
Identification of the problem and Motivation: formalising the research problem and justifying the solution value. In the context of this research, this is the elaboration of the research proposal, including the identification of the research gaps related to a lack of systematisation of design processes, data-driven cycles and computational technologies regarding data-driven urban design in the use of computational data-driven tools, and the lack of community-based developed computational data-driven tools.
Defining objectives of a solution; is related to the definition of the five objectives:
Understanding current data-driven urban design processes in practice and their enabling computational smart technologies;
Developing a framework to systematise an approach for data-driven urban design processes;
Developing a computational design toolkit prototype to assist urban design processes;
Demonstrating the computational toolkit prototype through a scenario;
Validating the integrated data-driven urban design approach amongst designers.
Design and Development: designing techniques and tools for artefact development and evaluation, as well as their development. Artefacts are constructs, models, methods, or instantiations (Hevner et al. 2010), or “new properties of technical, social, and informational resources” (Järvinen 2007, 49). This task is the realisation of Objectives 1, 2 and 3.
Demonstration: demonstrating that the artefact solves one or more instances of the problem. It is the realisation of Objective 4.
Evaluation: evaluation of the artefact. It is the realisation of Objective 5.
Communication: learning formalisation and communication of the research results. It is the produced thesis and publications.
Based on the six DSR steps and the five research objectives, this research can be designed into three main phases:
1. Conceptual Development Phase: This phase consists of creating an understanding of current data-driven urban design processes and its relationship to enabling computational smart technologies and developing a framework to systematise an approach for data-driven urban design processes.
The conceptual development phase tries to answer two research questions that are related to Objective 1 of this research. These two questions are divided into related sub questions for further detailing:
1. What are the current data-driven urban design processes in practice?
1.a What are the step-by-step elements of Data-Driven Urban Design Processes and their differences and similarities from traditional Urban Design processes?
1.b What are the Urban Design themes that Data-Driven Designers use to build their Urban Design Narrative and their differences and similarities from traditional Urban Design processes?
1.c How Data-Driven Designers gather, analyse, generate, and visualise data during design processes and their differences and similarities from a traditonal Urban Design process?
1.d What are the challenges in Data-Driven Urban Design Processes and their differences and similarities from traditional Urban Design Processes?
2. What are the current enabling computational technologies used in data-driven urban design processes?
2.a What are the current technologies used in data-driven and traditional urban design processes, and their differences and similarities?
2.b How are those technologies used?
2.c What are the strengths, weaknesses, opportunities, and threats to the use of computational technologies?
2. Computational Development Phase: This phase consists of creating a computational toolkit prototype to assist with data-driven computational urban design processes, based on the developed framework. The Framework and Computational Toolkit compose an integrated data-driven approach to assisting computational urban design processes. Also, this phase demonstrates the proposed approach through a scenario.
3. Validation Phase: This phase consists of the validation of the developed approach among designers.
| Research.Phases | Research.Objectives | Design.Science.Research.Steps | Research.Methods…Data.Collection | Research.Methods…Data.Analysis |
|---|---|---|---|---|
| Conceptual Development Phase | Understanding current data-driven urban design processes in practice and their enabling computational smart technologies | Identifying Problems and Motivate | Literature Review | Narrative Review |
| Defining Objectives of a Solution | ||||
| Developing a framework to systematise an approach for data-driven urban design processes | Design and Development | Semi-Structured Interviews | Thematic Analysis | |
| Computational Development Phase | Developing a computational design toolkit to assisting data-driven urban design processes | Development | Computational Prototyping | Reflective Practice |
| Demonstrating the integrated data-driven approach (framework and computational toolkit) to assisting computational urban design processes | Demonstration | |||
| Validation Phase | Validating the integrated data-driven approach to assisting computational urban design processes. | Evaluation | Focus group | Constant Comparison |
3.4 Research Phases
3.4.1 Conceptual Development Phase
3.4.1.1 Literature Review
The purpose of a literature review in a thesis is to critically evaluate existing research related to the topic and to identify gaps in the current knowledge that can be addressed by the study. There are different approaches to conducting a literature review, including systematic reviews, meta-analyses, and narrative reviews. This thesis proposes to use a narrative review approach to interrelate concepts in the literature.
Narrative reviews are a valuable approach to synthesising literature, as they provide a comprehensive and contextualised overview of the literature on a particular topic (Green, Johnson, and Adams 2006). Narrative reviews allow the researcher to interrelate different concepts from the literature and to explore how they relate to the research question. This is particularly useful in interdisciplinary fields, where multiple areas of knowledge intersect, as is the case in this research, where Smart Cities, Data-Driven Design, and Computational Design are interrelated.
Using a narrative review approach enables this research to identify gaps in the knowledge and highlight areas for future research. By synthesising the literature in a narrative review, this research identifies patterns and trends in the literature, as well as areas where there are discrepancies or contradictions in the findings (Baumeister and Leary 1997), thereby identifying areas where further research is needed and proposing research questions that can address these gaps.
As a first step in the conceptual development to create an understanding of data-driven urban design processes, this research conducted a literature review on smart cities, data-driven design, and computational design to acquire the information required for preliminary understanding.
This preliminary understanding was created based on theories and concepts from the literature review that highlight how urban design dimensions (Carmona 2002) are related to available computational smart technologies (Batty et al. 2012; Batty 2013a; Schuurman et al. 2012; Al Nuaimi et al. 2015; Bosch et al. 2017; Jamei et al. 2017; Alvear et al. 2018; Hammoudeh and Arioua 2018; Rajab and Cinkelr 2018; Yagol et al. 2018; Allam and Dhunny 2019; Oliveira Neto et al. 2019; Purohit and Kumar 2019; Xie et al. 2019; Chowdhury et al. 2020; W. Li, Batty, and Goodchild 2020; Ullah et al. 2020; Stojanovski et al. 2020; Yuan et al. 2020). Also, the literature review introduces the concept of data-driven design and how it is related to the emergent field of data analytics field, design processes and computational design methodologies and its relationship to digital toolmaking processes.
3.4.1.2 Semi-Structured Interviews
Semi-structured interviews are a research method that is commonly used in social science research to gather data through conversations with participants. The use of semi-structured interviews is appropriate in cases where the researcher wants to gain a deeper understanding of the participants’ experiences and perspectives, while also having the ability to ask follow-up questions and probe further into certain areas of interest (M. Q. Patton 2014). In the context of Design Science Research Methodology, semi-structured interviews are useful for identifying the needs and requirements of stakeholders, as well as for exploring the current state of practice.
As mentioned in Section 3.3, Design Science Research is a problem-solving approach that seeks to develop solutions to practical problems in a systematic way. As part of this methodology, it is important to gather information about the problem domain and the current state of practice in order to identify potential areas for improvement and further understand the interrelationship of concepts from a practical perspective. Semi-structured interviews are a useful tool for gathering this information because they allow the researcher to gather rich and detailed information from stakeholders about their experiences and perspectives related to urban design.
Therefore, face-to-face semistructured interviews were conducted with 8 designers and 8 data-driven designers worldwide. Interviewees were asked about: the design process, data-driven cycle, strengths, weaknesses, threats and opportunities of computational design tools. These interviews provide an overview of the current urban design practice and computational smart technologies, supporting the developed framework and guiding the development of the integrated data-driven urban design approach.
This research uses Thematic Analysis as a methodological approach to conduct semi-structured interviews analyses. Thematic analysis is a commonly used method for analysing qualitative data. It involves identifying and analysing patterns and themes within the data (Braun and Clarke 2006), which allows the researcher to develop a framework for understanding the data. This analysis seeks (a) to complement the conceptual development of the literature review to build a framework, and (b) to inform computational design toolkit prototype development.
According to Hevner et al. (2010), Design Science Research Methodology “involves the development of innovative products, processes, and systems that can be used to address important business and societal problems” (p. 76). Thematic analysis is a useful analytical method for developing solutions to practical problems because it allows the researcher to identify key themes and patterns within the data that can inform the development of design solutions. By identifying the key challenges and opportunities within the current practice of urban design, thematic analysis can inform the development of design solutions that address these challenges and capitalise on these opportunities.
The process followed a deductive approach, since interview results follow the pre-defined concepts from the literature review: the Design Processes, Data-Driven Cycles and Computational Tools. A deductive approach involves starting with a set of pre-existing theories or hypotheses and then testing these against the empirical data to confirm or refute them. In contrast, an inductive approach involves starting with the empirical data and then developing theories or hypotheses based on patterns or themes that emerge from the data. A deductive approach to thematic analysis involves starting with a set of pre-existing codes or themes that are based on existing theories or models, and then testing these codes or themes against the empirical data (Vaismoradi et al. 2016). The use of a deductive approach for analysing semi-structured interviews through thematic analysis is appropriate in the context of Design Science Research because it allows for the testing and refinement of existing theories or models. By starting with pre-existing codes or themes, the researcher can test these against the empirical data to determine those aspects of the theory or concept that need to be refined or revised, allowing for the emergence of new themes or patterns that may need to be incorporated into the existing theories or models (Vaismoradi et al. 2016). This can lead to a more robust and accurate understanding of the current state of practice in urban design, as well as the development of more effective data-driven urban design solutions.
Summing up, the use of semi-structured interviews as a research method to gain a snapshot of the current practice of urban design and the use of thematic analysis as an analytical method to develop strategies to support the development of an integrated data-driven urban design approach is a suitable research design within Design Science Research. Semi-structured interviews allow for a deeper understanding of the experiences and perspectives of stakeholders related to urban design, while thematic analysis allows for the identification of key themes and patterns within the data that can inform the development of design solutions. The combination of these two methods will provide a comprehensive understanding of the current practice of urban design, providing the instruments needed to develop strategies that inform the development of an integrated approach for data-driven urban design.
3.4.1.2.1 Semi-Structured Interviews Process
A round of interviews was conducted with designers and data-driven designers from June to December 2021. The interview participants were selected worldwide and the interviews were conducted either through videoconferences or and face-to-face meetings, conducted at the University of South Australia, City West Campus.
All interviews were audio and video recorded, and transcribed by the researcher, with a duration 60 minutes. The interviews had a total sample size of 16 interviewees, including eight traditional urban designers and eight data-driven designers. According to Guest, Bunce, and Johnson (2006), the data saturation during the definition of themes starts to happen after the sixth interview. Even though sample sizes are not statistically significant, they attend to the interview purpose, which is to support structuring an approaching for Data-Driven Urban Design in practice as a conceptual framework that informs the computational design toolkit prototype development.
The selection of participants is based in purposive sampling. Purposive sampling, also known as purposeful sampling, is a commonly used sampling method in qualitative research that involves selecting participants who have specific characteristics or experiences that are relevant to the research question (M. Patton 2002). In the context of semi-structured interviews, purposive sampling is a useful method for selecting participants who can provide rich and in-depth information about the research topic, emphasising the importance of selecting participants who can provide relevant and insightful information about the research topic (Clarke and Braun 2013). Furthermore, purposive sampling allows selection of participants based on specific criteria, such as their expertise, experience, or knowledge, which are relevant to the research question and can provide insights into the research topic (M. Patton 2002).
Participants were selected and divided in groups according to the following criteria:
Group 1: Traditional designers (designers without data-driven design experience) who have worked on urban design projects in academia or industry.
Group 2: Data-driven designers that have worked on urban design projects in academia or industry, with experience in urban design projects that use computational tools through a data-driven design approach.
Group 1 and Group 2 interviewees were chosen based on their professional or academic experience of at least five years regarding urban design projects and datadriven design, identifying participants through networking, online platforms, and professional social media.
These interviews were analysed using a thematic analysis to unfold designers’ perceptions on urban design processes. This analysis seeks to guide and inform the development of strategies for the conceptualisation of the development of the integrated data-driven urban design approach as a framework.
3.4.2 Computational Development Phase
3.4.2.1 Computational Toolkit Prototyping
After the conceptualisation of the approach as a framework in the previous stage, it is necessary to ensure its feasibility as an approach that addresses data-driven urban design as a “real-world problem”, assisting urban designers in this practice. To ensure the feasibility of the proposed approach, this research proposes a computational prototype implementation of the approach. Prototypes are widely recognised by the Human Computer Interaction (HCI) literature as one of the core methods for exploring and expressing computer artefacts (Houde and Hill 1997; Y.-K. Lim, Stolterman, and Tenenberg 2008; Wensveen and Matthews 2014). One of the main goals of prototyping is for examining design problems and evaluating solutions. Prototyping is intrinsically related to the activity of designing, since both activities involve an interactive co-evolutionary process of refinement of an artefact problem-solution as a manifestation of a design idea (Y.-K. Lim, Stolterman, and Tenenberg 2008; Cross 2011). In a research context, prototypes should enable a reflection on their activity in exploring the design space, generating new knowledge for the field (Y.-K. Lim, Stolterman, and Tenenberg 2008; Ventegodt, Merrick, and Andersen 2003; Wensveen and Matthews 2014).
With the advent of toolmaking (Ceccato 1999; Fischer, Fischer, and Universtität 2003; Burry 2011) as a common practice in the design practice and design research field (Duarte 2001; Fischer, Fischer, and Universtität 2003; Davis 2013; Nourian 2016; Belesky 2018), prototypes are becoming the process and product of reflective practice (Schön 2017), in which the knowledge can not be disassociated from the production method, since it is embedded in the process of tool creation as well as the purpose of the created tool. In a design research context, a prototype developed through a toolmaking process consists of feedback loops of proposing, building, testing, and retesting problem-solutions of tools, in which the derived knowledge produced is manifested for design and as design (Fischer, Fischer, and Universtität 2003; Janssen et al., n.d.; Belesky 2018).
A prototype is a common research strategy in Design Science Research (DSR) that enables researchers to explore and evaluate a range of design options and to assess their feasibility, validity, and potential impact in the real-world context. Prototyping is a reflective practice that enables researchers to engage in a creative, iterative, and collaborative process of design, development, and testing, which is essential for producing research artefacts that address real-world problems.
The use of prototypes as a research strategy is supported by the DSR paradigm, which is concerned with developing and evaluating innovative solutions to complex and often ill-defined problems in the real world (Hevner et al. 2010). Prototyping aligns with the principles of DSR as it allows for an iterative and reflective process of design and evaluation that produces a tangible artefact that can be tested and evaluated in a real-world context (Peffers et al. 2007).
According to Stolterman and Wiberg (2010), prototypes are an essential part of the reflective practice of design and are used to represent and explore design ideas, to communicate design concepts, to test and evaluate design options, and to provide feedback on the design process. Prototyping enables designers to engage in a process of “making as thinking” (Gaver and Dunne 1999), which involves exploring and reflecting on design ideas through the act of creating tangible artefacts.
Compared with other research methods, such as surveys, experiments, and case studies, prototyping provides a more hands-on, creative, and engaging approach to research that involves stakeholders in the design process (Peffers et al. 2007). Prototyping enables researchers to create tangible artefacts that can be used to explore and evaluate design options and to engage stakeholders in a collaborative process of design and evaluation (Stolterman and Wiberg 2010). Moreover, prototypes can be used to create a shared understanding of the design problem and to communicate design concepts and ideas to a wider audience (Buxton 2010).
Therefore, prototyping suits this research, since it is a valuable research strategy within DSR that enables researchers to engage in a reflective practice of design and evaluation that produces tangible artefacts that address real-world problems, aligning with the principles of DSR, and providing a hands-on, creative, and collaborative approach to research that engages stakeholders in the design process. Prototyping is a versatile research method that can be used to explore and evaluate design options, to create a shared understanding of the design problem, and to communicate design concepts and ideas to a wider audience.
Following this reasoning, the main aim of the computational toolkit prototype proposed is assisting data-driven computational urban design processes. The toolkit is built as a set of modular tools to gather, analyse, generate, and visualise data-design procedures. These tools are developed in a visual programming environment, integrated into a design platform. These tools seek to assist computational urban design processes, through building block functions that are combined by the designer to address specific urban design tasks. For instance, gathering GIS data, correlating datasets, plotting and visualising results as graphs. This modular and general approach allows flexibility to combine functions that target different datasets, which can be explored across multiple dimensions. It allows for exploration of different perspectives and interpretations during a data-driven urban design process, addressing more complex and target urban design tasks.
3.4.2.1.1 Prototyping Process
The computational toolkit prototype was developed as a plugin for a visual programming design environment called Sverchok. Sverchok is a visual programming environment for Blender, which is a free and open-source 3d software modeller. Despite Grasshopper for Rhinoceros 3D (Figure 3.3) currently being the most popular and utilised visual programming system, Grasshopper is not a piece of free software (Stallman 2002). Therefore, Sverchok (Figure 3.2) is currently the most suitable free and open-source visual programming language to develop scripts through visual programming. Currently, the Sverchok visual programming environment can be used to manipulate geometry, analyse data, and visualise information. Furthermore, Sverchok can expand its functionalities using a plug-in system, in which functionalities (nodes) are developed by a free and open-source community that integrates these new functionalities into the main system. Some examples of existing plugins include the Ladybug Tools for Blender for environmental simulations, Topologic for Network analyses, and IFCSverchok for creating BIM objects in a parametric environment. The proposed computational toolkit can be integrated alongside these plugins to expand and complement the functionalities even further.
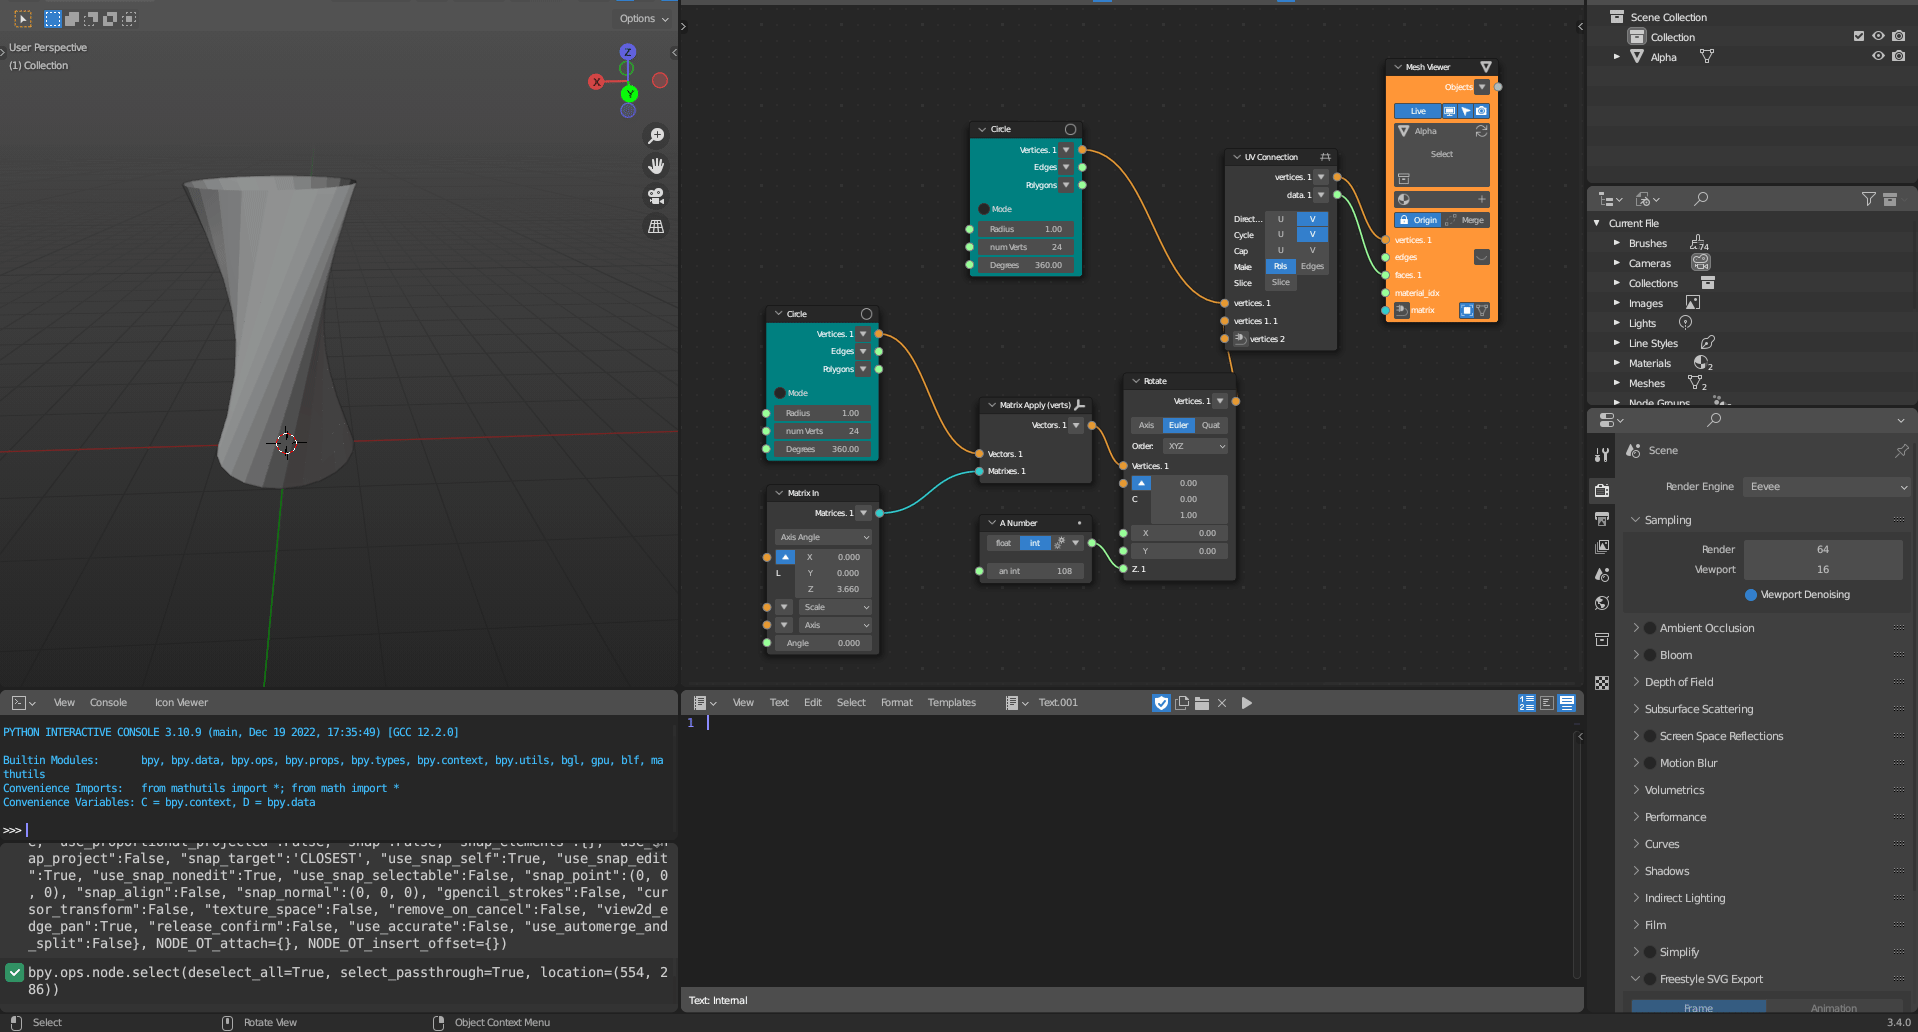
Figure 3.2: Sverchok Interface
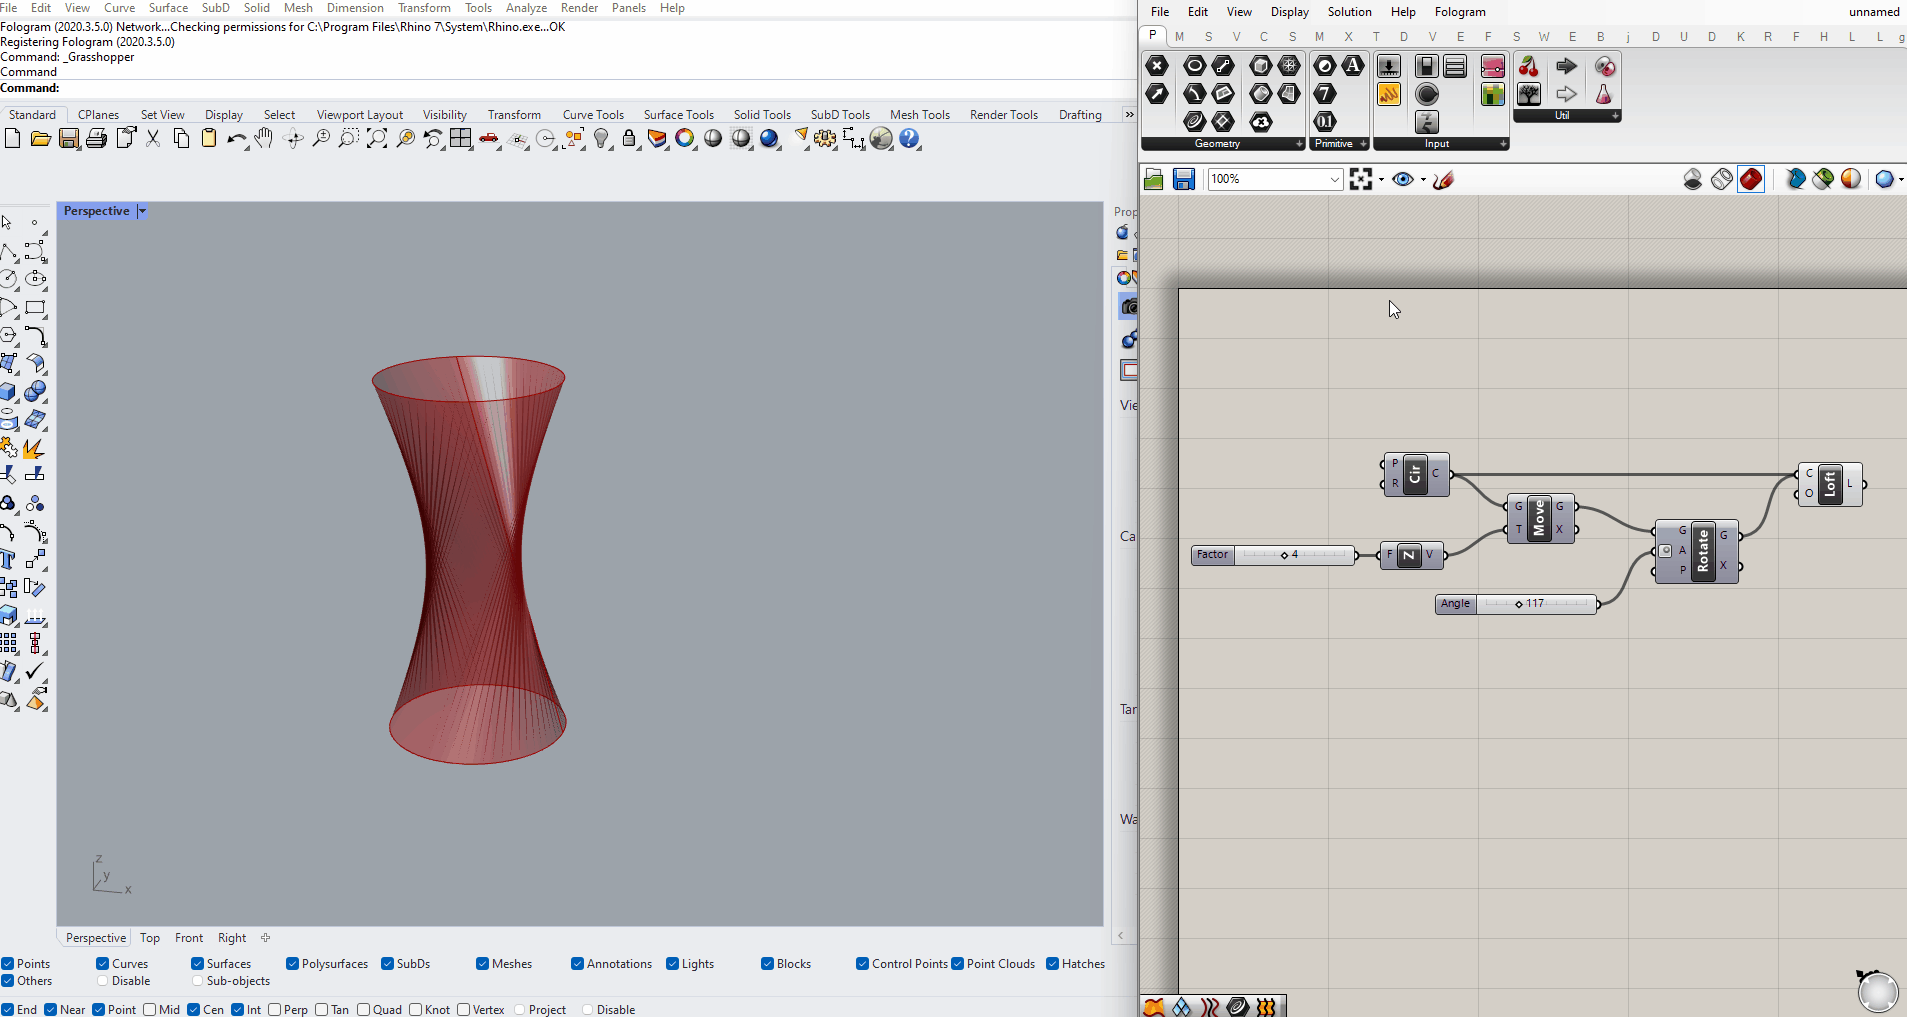
Figure 3.3: Grasshopper Interface
3.4.2.1.2 Scenario Demonstration
To conduct the demonstration during the focus group session was crucial: this involved the creation of a scenario where the different sets of tools were demonstrated to show their potential usability. Scenarios are limited descriptions of a system and how its environment may behave in specific situations, having a fundamental role in describing and clarifying features that are relevant in an application, evaluating design alternatives, unfolding requirements of a system, and validating designs (Campbell 1992; Benner et al. 1993). Generally, scenarios describe behaviours and situations of a system in two ways: a) the scenario proposes a situation expecting a determined behaviour; or b) the scenario suggests a behaviour determining those situations in which behaviour might manifest (Benner et al. 1993).
Scenarios have been used in HCI as a method of validation of the usability of a system, since scenarios can describe sequences of interactions between systems and users, which is a feature lacking in conventional software specifications that focus on describing the requirement that a system must satisfy (Carroll and Rosson 1992; Karat and Bennett 1991; Benner et al. 1993).
According to Guindon (1990), software designers tend to evaluate designs simulating scenarios mentally. Indeed, human problem-solving tends to be highly situated and expertise is organised in chunks that respond to specific situations, as research in cognitive science shows (J. R. Anderson 1982, 2014).
The context for demonstrating the proposed prototype could be set up for any city in the world that provides governmental open data and open-source services coverage/participation, since the approach does not aim to provide specific answers for urban design problems. Instead, it aims to help data-driven urban designers creating narratives that fit their own contexts. Therefore, Port Adelaide was chosen opportunistically for demonstrating the approach, since the area offers a situation as a background of redevelopment of an important historical area for Adelaide, as well as a suitable urban scale ranging from macro to micro-opportunities that provide potential for explorations across different urban design dimensions. Governmental and open-source data are available and covered for the area. The following subsection presents the selection criteria for Port Adelaide as a suitable scenario.
3.4.2.1.2.1 Selection Criteria for the Scenario
Urban design is a complex and multifaceted field, with numerous interdependent dimensions that impact the social, economic, and environmental aspects of cities. Developing effective urban design strategies requires an understanding of the current state of a city, as well as potential areas for improvement. One approach to achieving this understanding is using data-driven computational urban design tools. In this chapter, we will outline the rationale for selecting Port Adelaide as a scenario to demonstrate the proposed toolkit, as well as the criteria used to select the diverse range of datasets used in the analysis.
Port Adelaide was selected as a scenario to demonstrate the proposed data-driven computational urban design toolkit due to its unique geography and history, as well as its ongoing revitalization efforts. The use of diverse datasets across multiple urban design dimensions provides valuable insights into the current state of the city and informs urban design strategies for future development.
Port Adelaide was central during the colonisation of South Australia and its development occurred in parallel to the city of Adelaide. The city of Port Adelaide is located about eight kilometres from Adelaide CBD in the north-western suburbs. It covers 97 square kilometres, having one of the largest councils in metropolitan Adelaide, with a population of 132,400 people, according to the Australian Bureau Census of 2021 (Port Adelaide Enfield 2022). Since 2012, the area has been passing through a redevelopment through a long-term framework guiding the future development of the area, including the creation of up to 4000 homes (SA 2018) and reinterpretation of the character of the area to activate main streets in a pedestrian-friendly public realm.
Besides the opportunistic reason, several other reasons were also used to select Port Adelaide as a scenario. Firstly, it has a rich and diverse history, with the area being South Australia’s first commercial port. This history is valued in the revitalisation of the area, which has focused on active main streets, waterfront promenades, and the Port River (Hassell 2015). The area has undergone significant development in recent years, including new investment in commercial enterprises and residential activity, making it an attractive place to live, work and play (Hassell 2015). Secondly, the Port is an easily accessible regional centre within metropolitan Adelaide, offering a range of activities, including cafes, shops, pubs, cultural and leisure activities, and residential and commercial spaces. As such, it offers rich and rewarding experiences for both locals and visitors (Hassell 2015). Thirdly, the area’s unique geography and history provides an opportunity to explore a diverse range of urban design dimensions, including the waterfront and the revitalisation of historic spaces. Additionally, Port Adelaide is in the process of transforming its working harbour into a recreation harbour, offering a chance to reconnect the city centre with the waterfront (Hassell 2015). Finally, the selection of Port Adelaide is in line with the global trend of transforming abandoned working harbours into major city attractions, with waterfronts becoming prime locations for residences, offices, commercial, and cultural activities. All these characteristics of Port Adelaide make this area a feature rich scenario to be explored by the proposed approach. Figures 3.4 and 3.5 show, respectively, a satellite image and a streetscape image of Port Adelaide, respectively.
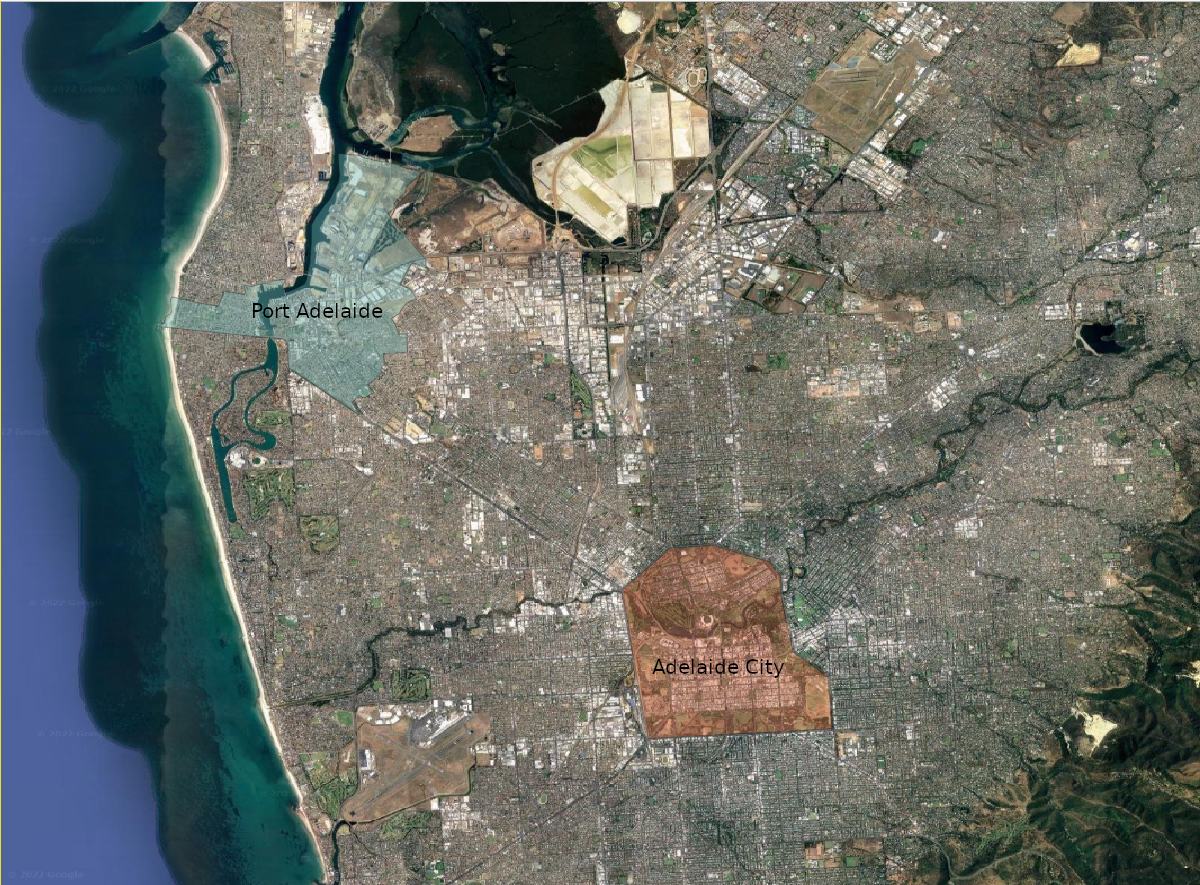
Figure 3.4: Port Adelaide and Adelaide City
![Port Adelaide Street Imagery [@mapillary]](images/research-design/port-adelaide-streetview.jpg)
Figure 3.5: Port Adelaide Street Imagery (Mapillary 2022)
3.4.2.1.2.2 Data Selection Criteria
To demonstrate the proposed data-driven computational urban design toolkit, a diverse range of datasets across multiple urban design dimensions were selected. These dimensions include land use, population density, transportation, infrastructure, and social and economic indicators, as presented in Table 3.2 in the next subsection. The datasets were chosen based on their relevance to Port Adelaide and their availability. Data sources were identified from publicly available sources, including government agencies and open-source services. This data was used to present the integration of the proposed computational toolkit.
3.4.2.1.2.3 Scenario Data Preparation
The set of tools explained in Chapter 5 and presented in Table 4.28 in Chapter 4 are demonstrated and commented upon through the Port Adelaide scenario in Chapter 5. The data used during the demonstration were gathered from governmental Australian open portals and open-source services. The governmental portals are Data SA, Elevation and Depth - Foundation Spatial Data (Elvis), and the Australian Bureau of Statistics. The data from open source services were collected through implemented visual programming nodes: OpenStreetMap API was used to gather geospatial data for generation and data analysis. Also, Mapillary was used to gather Street Imagery. Table 3.2 summarises the gathered data used during the demonstration.
| Data.Type | Description | Format | Source.Name | Source | Integrated.Toolkit.Downloaded |
|---|---|---|---|---|---|
| Port Adelaide Buildings Footprints | Buildings footprints and its properties | geoJSON | Open StreetMap | https://www.openstreetmap.org/ | Yes |
| Port Adeaide Street Network | Cleaned Street Network, containing edges, nodes, and features | OSM transfomed to Sverchok Geometry | Open StreetMap | https://www.openstreetmap.org/ | Yes |
| Port Adelaide Point Cloud | Point Cloud Model | las | Elvis - Elevation and Depth - Foundation Spatial Data | https://elevation.fsdf.org.au/ | No |
| Port Adelaide Digital Elevation Model | Digital Elevation Model | geotiff | Elvis - Elevation and Depth - Foundation Spatial Data | https://elevation.fsdf.org.au/ | No |
| Port Adelaide Street Imagery | Street Imagery | jpge | Mapillary | https://www.mapillary.com/app/ | Yes |
| Port Adealide Historical Images Metadata | Meta-data of historical images of Port Adelaide uploaded in Flicker | JSON | Data SA | https://data.sa.gov.au/ | Yes |
| Port Adelaide Populational Density | Populational Density data | csv | Australian Bureau of Statistics | https://www.abs.gov.au/ | No |
| Port Adelaide Household Size | Household Size data | csv | Australian Bureau of Statistics | https://www.abs.gov.au/ | No |
| Port Adelaide High Income Household | High Income Household data | csv | Australian Bureau of Statistics | https://www.abs.gov.au/ | No |
| Port Adelaide Born Overseas | Number of Port Adelaide residents that born overseas | csv | Australian Bureau of Statistics | https://www.abs.gov.au/ | No |
| Port Adelaide District Areas | Port Adelaide district boarders | geoJSON | Informed Decisions (ID) | https://housing.id.com.au/port-adelaide-enfield | No |
The scenario demonstration was pre-recorded, and it is available on YouTube12.
3.4.3 Validation Phase
To ensure the quality of the proposed approach, the validation process certifies its credibility and usefulness in assisting data-driven computational urban design processes among designers. Validation is a crucial step in DSR, since it ensures that the chosen methodology rigorously grants standards of quality.
Research validation is part of the evaluation process of an artefact. For Lucko and Rojas (2010) the validation process depends on the artefact proposed, and this process can be divided into six different types of validation: External Validity, Internal Validity, Content Validity, Face Validity, Criterion Validity, and Construct Validity. Briefly, External Validity is related to the generalisation of results; Internal Validity represents the causal data relations and their derivability;Content Validity focuses on whether or not the contents fairly represent a reality; Face Validity concerns subjective judgments of a non-statistical nature in a particular field; Criterion Validity compares results correlating with another instrument of measurement; and Construct Validity concerns whether or not the theoretical constructs are appropriated. According to Lucko and Rojas (2010), in the context of a proposition of a tool that aims to assist processes in a practical field, it is essential to ensure its face validity, providing “approval” from practitioners regarding the validity of the study. Furthermore, as the proposed prototype aims to assist with design practice, results deriving from the use of the prototype as a design tool “…do not have to be repeatable, and in most cases must not be repeated, or copied” (Cross 1982, 17). Therefore, face validity is crucial to ensure the approach’s feasibility and usefulness among designers, which is generally achieved by using a prototype demonstration (Lucko and Rojas 2010).
3.4.3.1 Focus Group
Focus groups are a common data collection technique in qualitative research that involve a small group of people discussing a specific topic or issue. They provide a way to gather in-depth data and explore different perspectives, opinions, and experiences. In the context of DSR, focus groups can be used to validate the computational prototype by gathering feedback from potential users and stakeholders. By doing so, the focus group can provide insights into the prototype’s usability, feasibility, and suitability for the intended purpose. The Focus Group was chosen as a method to assist the demonstration of the proposed approach among designers, since this is a qualitative, well-established method to collaboratively gather perceptions and feedback from experts gathered together to discuss the matter (Tharenou, Donohue, and Cooper 2007). Typically, a focus group is conducted by a moderator who encourages group discussion and interactions to produce data. Conducting focus groups is effective way to converge different points of view under the topic of investigation.
Also, compared with other qualitative research techniques such as case studies, Delphi, and interviews, focus groups have several advantages. First, focus groups allow for the collection of data from multiple participants simultaneously, which can lead to a richer and more diverse set of opinions and experiences. This can be particularly important in the context of validating a computational prototype, as it can reveal a range of perspectives on the prototype’s strengths and weaknesses (Hevner et al. 2010).
Second, focus groups can facilitate a collaborative and dynamic process of generating ideas and feedback. Unlike interviews or case studies, focus groups allow participants to interact with each other, share their ideas, and build on each other’s comments. This can lead to the identification of design flaws and opportunities for improvement that may not be apparent in individual interviews or case studies (Hevner et al. 2010).
Finally, focus groups can be a more efficient and cost-effective way to gather data from a group of participants than conducting individual interviews or multiple case studies.
There are three types of focus group: structured, unstructured, and semi-structured. Structured focus groups use a predefined set of questions. The moderator ask the questions verbally and collects the responses from the participants. In an unstructured focus group, there are no predefined questions, and the discussion is directed through a conversation with open-ended questions. Semi-structured focus groups mix both approaches, structured and unstructured, to allow for the flexibility of open-ended questions, while granting a structure and maintaining the direction of the discussions.
This thesis conducts the research through semi-structured focus groups, seeking to keep the structure of the three development strategies (framework and computational toolkit) that are presented in Chapter 4 as a set of structured questions, followed by a discussion of open-ended questions resulting from the main themes discussed in the previous questions.
3.4.3.1.1 Focus Group Design for Validation
Typically, a focus group session has no more than two hours (Guest, Bunce, and Johnson 2006) and is conducted through a protocol to discuss, collect and analyse data, and build a consensus, comprising between 5 and 12 participants (Grudens-Schuck 2004).
This research was conducted with a focus group with twelve participants worldwide, as presented in Table 6.2, equally divided among traditional designers and data-driven designers. Of the twelve participants, seven also were participants from the semi-structured interviews presented in Chapter 4.
Participants were invited by formal email and selected based on purposive sampling and availability. As mentioned in Section 3.4.1.2.1, purposive sampling emphasises the importance of selecting participants who are insightful and relevant for the research topic. Firstly, in this context, it was important to give preference to participants who had participated in the semi-structured interviews to have more cohesive outcomes. Then, to achieve a suitable number of participants to conduct a focus group and produce some diversity in the findings, extra participants, who had not participated in the semi-structured interviews, with a profile that matched the criteria from the interviews presented in Section 3.4.1.2.1, were included.
Since participants were located worldwide, the focus group was realised across three rounds, allocating participants together according to participants’ availability and time-zones. In order to ensure that the dynamic of the focus group was not affected by this setup, participants were allocated in groups with a minimum three participants. A virtual free and open-source collaborative whiteboard tool, Excalidraw13, was used to support the discussion across different rounds, since the previous rounds’ discussions were available through the platform as well as it was used to collect qualitative data. The sessions were of two hours’ duration, consisting of an explanation of the overall approach and framework developed, a demonstration of the computational prototype as proof of concept14, questions, and open-ended discussion. The group meetings were supported by videoconference software, Zoom.
As previously mentioned, the questions were based on the three development strategies of the framework and computational toolkit prototype, as well as the potential of the approach to be adopted by designers. The twelve participants answered eight questions individually using post-its from the whiteboard to visually structure their answers. Once all the questions were answered, an open discussion occurred based on the emerging themes and new inputs from participants.
The results of the focus group were analysed qualitatively through constant comparison. In analysing the data collected from focus groups, constant comparison is a suitable method to use as it is a systematic and rigorous approach to data analysis that allows for the identification of common themes and patterns across different groups of participants. This approach involves comparing and contrasting data within and across participants to identify patterns and themes that emerge from the data. The method was first introduced by Glaser and Strauss (1967) and has since been widely used in qualitative research. The approach allows for the identification of patterns and themes that emerge from the data, which can then be used to refine and improve the artifact being developed. As noted by Charmaz (2014), constant comparison helps to ensure that the analysis is not a one-time event but a dynamic process that is ongoing and iterative.
Furthermore, the use of constant comparison in the analysis of focus group data is in line with the principles of DSR methodology. According to Hevner et al. (2010), DSR emphasises the need for an iterative process of development, evaluation, and refinement of artefacts to ensure that they meet the needs of their intended users. The constant comparison method allows for the iterative refinement of the artefact based on feedback from the focus groups, which is in line with the iterative nature of DSR.
This analysis aims to validate the approach, focusing on three validation aspects: 1) Systematisation of Data-Driven Urban Design Processes; 2) Integrating Datasets, Design and Data Tools; and 3) A Holistic Toolmaking Development of a Computational Toolkit. This validation focus was based on the three development strategies of the proposed approach, which will be presented in Chapter 4. By framing the emergent themes from constant comparison analysis into the three development strategies of the approach, it seeks to achieve the face validity of the proposed approach, considering its usability and feasibility.
3.5 Conclusion
This chapter presented the research rationale, methodology, phases, and methods adopted to achieve the research aim. This research adopted the DSR methodology to develop an integrated approach to assisting data-driven urban design processes. To properly create an understanding of current data-driven urban design practice, semi-structured interviews were conducted after the literature review. From the findings of the semi-structured interviews, development strategies for the approach (framework and computational toolkit prototype) were traced, hence a framework was developed guiding the development of a computational toolkit prototype. To validate the feasibility and usability of the proposed approach, a focus group with traditional and data-driven designers was set up to receive inputs and feedback regarding the proposed approach. The following chapters follow the structure of the research phases, consisting of conceptual development, computational development, and validation, generating discussion and conclusion chapters.
The demonstration is available in YouTube through this link:https://youtu.be/lTRNIa2PwhQ↩︎
Excalidraw : https://excalidraw.com/↩︎
Available on YouTube: https://youtu.be/lTRNIa2PwhQ↩︎