4 Conceptual Development Phase: Semi-Structured Interviews
4.1 Introduction
In the previous chapter, the Research Design was presented, describing the three phases for conducting this research: the Conceptual Development Phase, consisting of the Literature Review, Semi-Structured Interviews, and Framework Development; the Computational Development Phase, consisting of the Computational Prototype Development; and the Validation, consisting of approach demonstration and its validation through a focus group (see Chapter 3 for more details).
This chapter presents the findings and discussion of the semi-structured interviews conducted with the sixteen designers. The designers were equally chosen from two groups: traditional designers and data-driven designers (see Chapter 3 for details).
These semi-structured interviews have the purpose of providing a snapshot of the current urban design practice, including traditional and data-driven design perspectives in relation to enabling computational smart technologies. Additionally, they aim to provide guidance in the development of an integrated data-driven urban design approach, consisting of the conceptual framework and computational toolkit prototype.
This chapter is organised into five sections: Section 4.1 introduces the chapter, Section 4.2 presents the interview findings, following the structure of interview questions, which are based on the design process (Gero 1990; Gero and Kannengiesser 2004; Yu, Gu, and Ostwald 2021), data-driven cycle (Deutsch 2015; Mathers 2019; Runkler 2020; A. Liu, Wang, and Wang 2022), and computational tools (Maguire 1991; Alonso et al. 2004; Botsch et al. 2010; Grekousis 2020; Runkler 2020; Dieck, Jung, and Loureiro 2021; Byerly, Kalganova, and Ott 2022). Across these three sections, thirteen interview findings are presented and enumerated. Section 4.3 presents a discussion, highlighting four main points. Section 4.4 presents how the four main points of discussion guided the three strategies for the framework and computational toolkit development, as well as the requirements and justification of the proposed tools; and Section 4.5 concludes the chapter.
4.2 Interview Findings
In the following subsections, the findings from the semi-structured interviews are presented. These findings are organised based on the concepts of the design process, data procedures, and computational tools, since these three concepts were used to compose the interview questions. The interview questions were framed into three meta-themes: the Design Process, Data Procedures, and Computational Tools, according to the two research questions elaborated based on the literature review. From the meta-themes, themes were defined during the interview coding process, using repetition and comparison methods (Guest, MacQueen, and Namey 2011).
- Design Process:
The Design Process analysis focuses on how designers and data-driven designers describe their design process step-by-step.
- Data Procedures:
The Data Procedures uses explanatory reasoning to investigate how designers and data-driven designers gather, analyse, generate, and visualise data/information during the design process.
- Computational Tools:
The Computational Tools use explanatory reasoning to investigate designers and data-driven designers who use (or do not use) computational technologies during the urban design process. Also, this step explores what they understand as the strengths, weaknesses, opportunities, and threats of the use of computational tools. This stage will provide insights into the computational design toolkit prototype development.
As mentioned, and explained in Chapter 3, participants were divided into two groups. Traditional designers and data-driven designers. Table 4.1 presents the participants’ profiles.
| Participant.ID | Group | Background | Years.of.Experience |
|---|---|---|---|
| AR | 1 | Urban Designer, and Planner |
|
| CB | 1 | Architect, Urban Designer, and Planner |
|
| LG | 1 | Architect, and Urban Designer |
|
| RS | 1 | Architect, Urban Designer, and Planner |
|
| WG | 1 | Urban Designer, and Planner |
|
| DB | 1 | Architect, Urban Designer, and Planner |
|
| RT | 1 | Urban Designer and Planner |
|
| HP | 1 | Urban Designer and Planner |
|
| AC | 2 | Architect and Urban Designer with experience in Environmental Design projects, and Computational Design |
|
| DL | 2 | Architect and Urban Designer with experience in Master Plans, and Computational Design |
|
| TT | 2 | Architect and Urban Designer with experience in Urban Analytics, and Computational Design |
|
| GP | 2 | Architect and Urban Designer with experience in BIM, and Computational Design |
|
| DE | 2 | Architect and Urban Designer with experience in Urban Analytics, and Computational Design |
|
| FM | 2 | Architect and Urban Designer with experience in Urban Developments of Hotels and Resorts, and Computational Design |
|
| JM | 2 | Architect and Urban Designer with experience in Master Plans and Urban Placemaking, and Computational Design |
|
| JD | 2 | Architect and Urban Designer with experience in Urban Analytics, and Computational Design |
|
Tables 4.2 and 4.3 show the relationships between the research questions, interview questions, and data analysis stages.
| Sections | Research.Questions | Interview.Questions |
|---|---|---|
| Design Process | 1a | “When you receive an urban design brief, what are the steps you usually follow; a) to understand context (context analysis) and site (site analysis) to identify strengths and weaknesses of the site and opportunities and threats to the site from the surroundings; b) propose a design strategy/solution; c) communicate the design and results?” |
| 2a | “Do you use any computer software to help you to make decisions during analysis and the decision-making process? 5b- If so, what software and during which stages?” | |
| 1d | “Can you describe challenges that you usually face during the decision-making processes while you are designing a new urban area?” | |
| 1c, 2b | “Based on the data and contextual themes defined before, can you describe with an example how the data and analysis inform your design strategy/solution?” | |
| 1b | “During context analysis, what are the context themes generally analysed and why? (e.g., history, strategic plans, demographics, economic, socioeconomic questions and só forth)?” | |
| 1c | “Based on the data and contextual themes defined before, can you describe with an example how the data and analysis inform your design strategy/solution?” | |
| Data Workflow | 1c | “What are the data required to proceed with the contextual themes and site analysis from which source(s) is/are the data usually collected?” |
| 1c | “b) What are the strategies you have used to integrate different datasets in the analysis?” | |
| Computational Tools | 2c | “In your opinion, what are the current barriers and potentials for the use of big data to help designers in the decision-making process?” |
| Sections | Research.Questions | Interview.Questions |
|---|---|---|
| Design Process | 1a | “When you receive an urban design brief, what are the steps you usually follow; a) to understand context (context analysis) and site (site analysis) to identify strengths and weaknesses of the site and opportunities and threats to the site from the surroundings. b) propose a design strategy/solution; c) communicate the design and results? d) What are the computational tools that you use during the process?” |
| 1d | “Can you describe challenges that you usually face during the decision-making processes while you are designing a new urban area?” | |
| 1c,2b | “Based on the data and contextual themes defined before, can you describe with an example how the data and analysis inform your design strategy/solution?” | |
| 1b | “During context analysis, what are the context themes generally analysed and why? (e.g., history, strategic plans, demographics, economic, socioeconomic questions and so forth)?” | |
| 1c | “Based on the data and contextual themes defined before, can you describe with an example how the data and analysis inform your design strategy/solution?” | |
| Data Workflow | 1c | “What are the data required to proceed with the contextual themes and site analysis and from which source(s) is/are the data usually collected?” |
| 1c | “b) What are the strategies you have used to integrate different datasets in the analysis?” | |
| Computational Tools | 2c | “In your opinion, what are the weaknesses and strengths in the computational tools that you use?” |
| 2c | In your opinion, what are the current barriers and potentials for the use of big data to help designers in the decision-making process? |
Finally, from the interview findings and the pre-defined structure of concepts coming from the literature review, the conceptual framework was defined, as well as the strategies for the development of the computational toolkit prototype.
4.2.1 Design Process
The design process has been widely discussed in the literature (Gero 1990; Cross 2011; Lawson 2006; Gero and Kannengiesser 2004; Mahmud Rezaei 2020). From a systematic perspective, the design process is defined as a special kind of problem-solving process (William J. Mitchell 1975) involving a set of needs, requirements, and intentions that are synthesised into an artefact with an intent of use (Dorst 2003). According to Gero (1990), the design process is composed of five main non-linear iterative steps: problem formulation, synthesis, analysis, evaluation, and documentation, as presented in Chapter 2.
When design concerns the relationship between human activity and the civic space of the built environment, it becomes Urban Design, a process of ordering human settlements through design (Kasprisin 2011).
Although there are several definitions of the Urban Design Process (Palazzo and Steiner 2012; Levy 2009; Abd Elrahman and Asaad 2019; Mahmud Rezaei 2020; Carmona 2021), this research adopts Gero’s design process definition (Gero 1990), as this framework better describes and unfolds the cognitive steps of design processes through a comprehensive and flexible approach to understand the design processes.
In this section, this research seeks to understand how urban designers conduct the design process from formulation to documentation.
4.2.1.1 Formulation and Analysis
This subsection highlights four findings regarding formulation and analysis:
1- Both groups agree about the uniqueness of each urban design project in relation to its context;
2- Each designer has their own approach to conducting project contextualisation;
3- There is plurality of approaches on the use of themes for project contextualisation;
4- Traditional Designers and Data-driven Designers tend to prioritise different urban design dimensions.
Design is a special kind of non-linear problem-solving process (William J. Mitchell 1975; Cross et al. 1984; Lawson 2006). Therefore, when designers receive a design brief, the first step they take is to try to understand the problems and the potential solutions that can be explored. This negotiation between problem and solution requires formulating hypotheses and conducting several rounds of analysis to investigate potential solutions.
Urban design problem-solution formulation tends to start with the contextualisation of the site intervention (Carmona 2021). Participants were asked how they conduct a context and site analysis in an urban design project. The findings highlight that both groups tend to agree on the uniqueness of each urban design project in relation to its context, demanding different datasets to cover specific site requirements. However, the findings also suggest that designers tend to prioritise different sets of information during the creation of the project background, which depend on their personal experience, preferences, and project circumstances. The interviewees also expressed concern that every project is specific to its physical, natural, cultural, and social context, requiring the use of different data types as well as a diverse combination of datasets in order to contextualise an urban design project.
“When I am contextualising the site, I generally like to have a general overview of the site, which depends on the site project and its context, but we look at how the place is formed, its human history, etc., defining what are the influences in terms of context” (WG -Group 1)
“Okay, obviously, the first step is the context analysis, to understand everything about the context. Not just about the site, but the social context, cultural context, social data…all the information about the location…not just specific about the site, but about the surrounding site in the city, where the site is located…these are the first steps of analysis…deep analysis, I get as much information as possible, so, I can start to understand what’s going on there…that is the first step.” (JD - Group 2)
Finding 2 suggests that each designer has their own approach to conducting project contextualisation, and occasionally, these singularities tend to emphasise and narrow to specific urban features, neglecting other potential features. For example, FM has a business related to hotel and resort design, and his approach is strongly based on feasibility, legislation, and environmental design. On the other hand, JM has councils as his primary clients, and his approach tends to be more about Site-Based Mapping, trying to understand the space dynamics and their morphology.
“First, I do access the legal parameters, the design context, because those legal parameters are going to let me determine what is a weakness…what is a strength…and what I can do and make, and what I cannot do… Then, I am going to go and try to place more in depth. Before everything, I am going to check the laws that were even gone, and then the laws that are available…the laws that [remain] standing” (FM - Group 2)
“We do more specific site-based mapping. Essentially, what we call structure plans, those typically fall underneath four categories, which would be: movement, public domain, character, and built form.” (JM - Group 2)
Finding 3 suggests that there is a plurality of approaches among Groups 1 and 2 in terms of the use of themes for project contextualisation.
“At that scale [neighbourhood] it becomes a bit of not just necessarily how does the site work and where it is located, but how it is going to affect the overall region, because from [a] transportation point of view, you are going to have to import and export, and that’s going to lead you to whether do you need to expand roads, how much area you’re going to need for transportation …” (DE - Group 2)
“Physical form of the site, morphology: how big, how high, how low, how wide…what are the physical characteristics of the build form in the site…transparency, light, heavy… Movement Systems: mechanical trains, trams, people, cyclists, cars” (CB - Group 1)
Besides acknowledging the importance of several themes of project contextualisation, Finding 4 suggests that Group 1 and Group 2 tend to prioritise different aspects during the contextual analysis, as can be seen in Tables 4.4 and 4.5. At least half of participants from Group 1 emphasised Activity and Built Form as drivers of contextual analysis, while in Group 2, Spatial Analysis was the most highlighted aspect, followed by Environmental Analysis. Additionally, at least half of the participants from both groups highlighted History as an important theme. These results accentuate that, despite the heterogeneity between groups, the contextual analysis realised by Group 1 and 2 tends to prioritise different urban design dimensions (Contextual, Morphological, Visual, Spatial, Sustainable, Perceptual, Functional, and Social) (Carmona 2002). Group 2 devoted less attention to the Perceptual and Social dimensions, while Group 1 devoted less attention to the Functional and Sustainable dimensions.
| Themes.of.Project.Contextualisation | Urban.Design.Dimensions | Frequency | Participants | Percentage.of.Participants |
|---|---|---|---|---|
| History | Contextual, Visual | 5 | AR,DB,LG,RT,WG | 63% |
| Activity | Perceptual | 5 | CB,AR,DB,LG,WG | 63% |
| Build Form | Morphological | 4 | CB,AR,DB,LG | 50% |
| Strategic Plans | Functional | 3 | CB,RS,WG | 38% |
| Place | Perceptual | 2 | CB,AR | 25% |
| Demographics | Social | 1 | RS | 13% |
| Economic | Functional | 1 | RT | 13% |
| Social | Social | 1 | RT | 13% |
| Environmental | Sustainable | 1 | RT | 13% |
| Public Domain | Social | 1 | RS | 13% |
| Themes.of.Project.Contextualisation | Urban.Design.Dimensions | Frequency | Participants | Percentage.of.Participants |
|---|---|---|---|---|
| Spatial Analysis | Functional | 6 | AC, DL, GP, TT,JD,JM | 75% |
| Strategic Plans | Functional | 5 | DE, GP, TT,JM,JD | 63% |
| Environmental | Sustainable | 4 | AC, DE, GP,FM | 50% |
| History | Contextual, Visual | 4 | GP, TT,JM,JD | 50% |
| Cultural | Contextual | 3 | AC,JM,JD | 38% |
| Demographics | Social | 3 | AC, GP,JD | 38% |
| Economic | Functional | 3 | AC, DE, JM | 38% |
| Infrastructure | Functional | 3 | AC, DL, GP | 38% |
| Social | Social | 3 | AC, GP,JD | 38% |
| Activity | Perceptual | 2 | DL, JM | 25% |
| Socio-Economic | Social | 2 | GP,JD | 25% |
| Built Form | Morphological | 1 | JM | 13% |
| Character | Morphological | 1 | JM | 13% |
| Feasibility | Functional | 1 | JM | 13% |
| Place | Perceptual | 1 | JM | 13% |
| Public Domain | Social | 1 | JM | 13% |
| Security | Social | 1 | TT | 13% |
| Themes.of.Project.Contextualisation | Urban.Design.Dimensions | Frequency | Participants | Percentage.of.Participants |
|---|---|---|---|---|
| History | Contextual, Visual | 9 | AR,DB,LG,RT,WG,GP,TT,JM,JD | 56% |
| Strategic Plans | Functional | 8 | CB,RS,WG,DE, GP,TT,JM,JD | 50% |
| Activity | Perceptual | 7 | CB,AR,DB,LG,WG,DL, JM | 44% |
| Spatial Analysis | Functional | 6 | AC, DL, GP, TT,JD,JM | 38% |
| Environmental | Sustainable | 5 | RT,AC, DE, GP,FM | 31% |
| Built Form | Morphological | 5 | CB,AR,DB,LG,JM | 31% |
| Demographics | Social | 4 | RS,AC, GP,JD | 25% |
| Economic | Functional | 4 | RT,AC, DE, JM | 25% |
| Social | Social | 3 | RT,AC, GP,JD | 19% |
| Cultural | Contextual | 3 | AC,JM,JD | 19% |
| Infrastructure | Functional | 3 | AC, DL, GP | 19% |
| Place | Perceptual | 3 | CB,AR,JM | 19% |
| Socio-Economic | Social | 2 | GP,JD | 13% |
| Public Domain | Social | 2 | RS,JM | 13% |
| Security | Social | 1 | TT | 6% |
| Feasibility | Functional | 1 | JM | 6% |
| Character | Morphological | 1 | JM | 6% |
4.2.1.2 Synthesis and Evaluation
This subsection presents two findings regarding synthesis and evaluation:
5- The synthesis of an urban design project involves multiple contextualised design factors;
6- Visual Programming and Statistical Methods are the most used techniques during synthesis and evaluation steps;
During and after the synthesis process, designers tend to iteratively test design strategies against the formulated design goals and their expected outcomes. Generally, several rounds of synthesis and evaluation are required until designers reach a satisfactory and acceptable outcome.
“In Urban Design, I very rarely come out with a single solution” (CB - Group 1)
Designers typically make preliminary assumptions based on context and site analysis, which are then synthesised into relational diagrams, textual descriptions, and spatial conceptualisations, among other strategies (Lawson 2006). These syntheses form a specific design strategy. When asked about how they propose a design strategy, the findings of the study reinforced that design is a contextualised practice that depends on various factors, such as project context, budget, culture, and political agenda, as well as the designers’ own vision and personal preferences, which all contribute to shaping how design is conducted.
“I believe that every project and brief has different processes, that you build a custom process for every building, project or study… So, I don’t think that there is a standard way to go along” (AC - Group 2)
“First, depending on what is the context of which came relates to the context, as in the what’s the initiative behind [the] projects, and based on this, well, it supports to develop strategies on …” (LG - Group 1)
During the synthesis and evaluation process, designers explore how the target urban system works, evaluating both external and internal driving forces and their relationships to the current proposed design solution candidate. They seek to understand possible relationships among different urban design concerns, synthesising concepts and ideas and evaluating the outcomes against developed hypotheses. This iterative process of synthesis and evaluation seeks to create a cohesive narrative for the design proposition. Synthesis and evaluation are essential for constructing strong design narratives and validating a design proposition. Tables 4.7, 4.8, and 4.9 show the synthesis and evaluation techniques cited.
| Synthesis.Evaluation.Technique | Participants | Number.of.Participants | Perc.of.Participants |
|---|---|---|---|
| Visual Programming | AC,DE,JD,JM,DL,FM | 6 | 38% |
| Statistical Model | TT,AR,CB,RS,RT | 5 | 31% |
| GIS | DB,JD,JM,LG | 4 | 25% |
| 3D Model | JM,FM | 2 | 13% |
| Application Programming Interface (API) | AC | 1 | 6% |
| BIM | GP | 1 | 6% |
| Synthesis.Evaluation.Technique | Participants | Number.of.Participants | Perc.of.Participants |
|---|---|---|---|
| Statistical Model | AR,CB,RS,RT | 4 | 50% |
| GIS | DB,LG,WG | 3 | 38% |
| Synthesis.Evaluation.Technique | Participants | Number.of.Participants | Perc.of.Participants |
|---|---|---|---|
| Visual Programming | AC,DE,JD,JM,DL,FM | 6 | 75% |
| GIS | JD,JM | 2 | 25% |
| 3D Model | JM,FM | 2 | 25% |
| Application Programming Interface (API) | AC | 1 | 13% |
| BIM | GP | 1 | 13% |
| Statistical Model | TT | 1 | 13% |
Finding 6 suggests that Visual Programming and Statistical Methods are the most used techniques for synthesising and evaluating data during the design process. These techniques appear to be employed by both groups, with half of participants from Group 1 using Statistical Models, and more than half of participants from Group 2 using Visual Programming.
4.2.1.3 Documentation
This subsection highlights one finding regarding documentation:
7- Documentation in the urban design process should have a narrative, engage stakeholders, and be simple, transparent and interactive.
Documentation is an essential step in the design process, as it allows designers to communicate their work to the design team and other stakeholders. This process involves the production of both graphic and textual material that represents the intent and purpose of a design proposition.
Finding 7 suggests that there is agreement between both groups on the importance of simplicity, narrative, and stakeholder engagement. Simplicity was mentioned as a way of conveying information easily, enabling people from different backgrounds and levels of education to understand the project’s purpose effectively. Additionally, narrative was seen as a way of providing context and meaning to the design, while stakeholder engagement was seen as a way of ensuring that the design meets the needs of the stakeholders.
Overall, documentation is an important step in the design process, as it allows designers to communicate their work to the design team and other stakeholders. By producing both graphic and textual material that represents the intent and purpose of a design proposition, designers can ensure that their work is understood and appreciated by all stakeholders. Additionally, by focusing on simplicity, narrative, and stakeholder engagement, designers can ensure that their work is accessible and meaningful to all.
“Well! If it’s not professionals…the way that I am going to pitch the idea… we must be more… I don’t know how to say…”digestible”, more user-friendly, let’s say, avoiding technical plans or trying to avoid abstract diagrams, sections, perhaps, using more 3D representations, renders…and if possible, a physical model…” (TT - Group 2)
The Narrative is the project’s storytelling, defining either project priorities or being defined by them. It establishes the project’s vision.
“…from information we set up a strategy, and a design strategy or overall design narrative. For example, if is about creating an interlock of land in the water and created sustainable habitats that merges to urban developments and water system…” (DL - Group 2)
Stakeholder engagement underscores the significance of community involvement and client engagement during the design process. It is essential to ensure that stakeholders are consulted, and their views considered when making decisions.
“First, I think it is important to encourage the community…supports to participate, depending on the project. Also, you had their approval to check if there are with you and this decision if they agree with the intervention and I think [it] also important to explain all the results were identified in the interviewing process…” (GP - Group 2)
Transparency is related to making the design process explicit, showing the step-by-step of the decision-making process and how this process shapes design solutions.
“Communication to me is all about that ….making the process explicit…everything is not obvious, but you learn along the way…..(iterative process)”(CB - Group 1)
Interactivity was mentioned as a way of presenting a project for clients, in which they can try different possibilities, solutions through parametric generations.
“We normally set up a demo where we display interactively, then we display possible solutions […] we normally start with parametric modelling and [an] interactive demo to show for clients” (AC - Group 2)
Summing up, Finding 6 suggests that design communication should tell a story about the project, establishing the project vision, engaging the community and clients throughout the process, and communicating ideas in a simple and straightforward manner. Additionally, design communication should facilitate stakeholders’ interaction with design solutions, and should make the design process explicit to all parties involved. Technologies such as Virtual Reality and Augmented Reality, Visual Programming, Rendering, Graphic Design, Physical Models, and Sketching were mentioned by designers as enablers of these features.
“Finally, present the projects as you say […] they want to see the pretty pictures, animations, diagrams to make sure they understand.” (DE - Group 2)
“Well, the most effective way to share an idea is an abstraction in Urban Planning and Urban Design… I believe it will be like diagrams… lots of diagrams.” (TT - Group 2)
“Master plan and 3d render…is what people are interested in. History telling” (RS - Group 1)
“[…] Immersive interactive designs workshops” (AC - Group 2)
“The other thing is like VR or AR stuff, that’s something that is very useful as well.” (DE - Group 2)
“Augmented Reality…diagrams…3D representations… physical models” (GP - Group 2)
“For me, I have a PowerPoint presentation, I have animations, I have videos… I’ve even used VR. When we did the work in Rio with the students, we took a portable VR system…to show residents how you could transform their environment.” (JD - Group 2)
4.2.2 Data-Driven Cycles
The Data-Driven Cycle is the process of data flow transformations during the design process, from data to information, from information to knowledge, and from knowledge to action (A. Liu, Wang, and Wang 2022). This process is formalised through data operations.
From a data-driven urban design process perspective, data operations can be synthesised into four steps: gathering, analysis, generation, and visualisation. It is important to understand data procedures from an urban design perspective, since they are the link between the data and the design problem-solution process. Other disciplines may have additional data procedures steps, such as engineering (A. Liu, Wang, and Wang 2022), which are unrelated to the Urban Design field.
The following subsections present the results on the data-driven cycle based on the four aforementioned data steps.
4.2.2.1 Gathering
This subsection highlights one finding regarding the data gathering step:
8- Public and Open datasets are essential for data-driven urban design processes.
Designers tend to use different data providers during the data gathering process, which can vary depending on the designer’s context and available economic resources. Table 4.10 shows the main sources of data gathering according to access to data. Publicly available datasets have an important role during this data gathering process, as more than half of participants use governmental providers to gather data, highlighting the importance of publicly available resources in the urban design field.
| Data.Source | Participants | Frequency | Percentage.of.Participants |
|---|---|---|---|
| Governmental | DL, GP, TT, FM, JM, JD,LG,RT,WG | 9 | 56% |
| Open Data | AC, DE, GP,TT,FM,RT | 6 | 38% |
| Private Companies | DE, DL, GP,JM,LG | 5 | 31% |
| Freeware | DL,GP | 2 | 13% |
| Social Media | TT | 1 | 6% |
| Client | JD | 1 | 6% |
Comparing Groups 1 and 2 with regard to data gathering sources, as shown in Tables 4.11 and 4.12, suggests an emphasis on governmental public datasets. Group 2 tends to rely more on open and governmental data than Group 1, with more than half of Group 2 participants using open source and governmental providers.
| Data.Source | Participants | Frequency | Percentage.of.Participants |
|---|---|---|---|
| Governmental | JD,LG,RT,WG | 4 | 50% |
| Private Companies | LG | 1 | 13% |
| Open Data | RT | 1 | 13% |
| Data.Source | Participants | Frequency | Percentage.of.Participants |
|---|---|---|---|
| Governmental | DL, GP, TT, FM, JM, JD | 6 | 75% |
| Open Data | AC, DE, GP,TT,FM | 5 | 63% |
| Private Companies | DE, DL, GP,JM | 4 | 50% |
| Freeware | DL,GP | 2 | 25% |
| Social Media | TT | 1 | 13% |
| Client | JD | 1 | 13% |
Furthermore, private companies were cited for use by half of the participants in Group 2. However, the data gathering process will vary depending on the project’s budget, scale, and client.
“I think that depends very much on the scale of a project, but it’s something like I said, if it is something very specific, we usually rely a lot on consultants. At least if they give you the budget size, but if it’s something smaller, then you can get away with it and use more open-source tools to pull information from.” (DE - Group 2)
“Every project you need to look at different, like data sources, every different culture needs a different sort of data-driven process […] We look at Open Street Maps, the Urbano the tool in Grasshopper that allows you to like can get all those data […] we can use whatever data we get, but then every project will be different in its process” (AC - Group 2)
” I always try to find some open data. So, I think the easiest one related to urban cities today…it is Google Earth or Google Maps…you can find some information, and some data related to topography, density, roads, layouts…we also have some analysis […] we have database sites and platforms like a CAD Mapper…” (GP - Group 2)
“I think the most reliable would be the public datasets that city provides” (TT - Group 2)
Finding 8 shows that public and open datasets are essential in the data gathering process for both groups.
4.2.2.2 Analysis
This subsection highlights one finding regarding the analysis step:
9- Spatial and Contextual are the most analysed urban design dimensions among both groups.
The analysis process starts after designers have considered that they have gathered sufficient data to start contextualising and making assumptions about the design brief (Moughtin 2007; Ostime 2019). These analyses will depend on the type of data gathered.
Finding 9 shows (Table 4.13) that Spatial and Contextual urban design dimensions (Carmona 2021) are the most cited and, respectively, analysed through GIS and Historical Documents. Tables 4.14 and 4.15 show that Group 1 tends to rely more on Historical Documents while Group 2 on Spatial Data. Even though there are different preferences for analysed urban design dimensions between groups, Finding 9 suggests an emphasis on Spatial and Contextual data for both cases.
| Data.Dimension | Participants | N.Participants | Perc.of.Participants | Data.Format |
|---|---|---|---|---|
| Spatial | DB,JM,GP,JD,DL,TT,FM,LG | 8 | 50% | GIS= 7 (88%), BIM = 1 (13%), CAD = 7 (88%) |
| Contextual | WG,GP,RT,TT,JM,JD,LG | 7 | 44% | Historical Documents = 7 (100%) |
| Sustainable | RT, FM, AC, GP, AC | 5 | 31% | EPW = 5 (100%) |
| Social | RT,GP,JM,JD,RS | 5 | 31% | Survey = 5 (100%), Census = 1 (20%) |
| Visual | TT,GP,LG | 3 | 19% | GIS=3 (100%) Historical Documents = 2 (100%) |
| Functional | JD, RT | 2 | 13% | Reports = 2 (100%) |
| Perceptual | TT | 1 | 6% | Social Media = 1 (100%) |
| Morphological | JD | 1 | 6% | GIS=1 (100%) |
| Data.Dimension | Participants | N.Participants | Perc.of.Participants | Data.Format |
|---|---|---|---|---|
| Contextual | WG,RT,LG | 3 | 38% | Historical Documents = 3 (100%) |
| Spatial | DB, LG | 2 | 25% | GIS= 2 (100%), CAD = 2 (100%) |
| Social | RT, RS | 2 | 25% | Survey = 2 (100%), Census = 1 (50%) |
| Morphological | CB,RT | 2 | 25% | GIS=2 (100%) |
| Functional | RT | 1 | 13% | Reports = 1 (100%) |
| Sustainable | RT | 1 | 13% | EPW = 1 (100%) |
| Visual | LG | 1 | 13% | GIS=1 (100%) Historical Documents = 1 (100%) |
| Data.Dimension | Participants | Number.of.Participants | Perc.of.Participants | Data.Format |
|---|---|---|---|---|
| Spatial | JM,GP,JD,DL,TT,FM | 6 | 38% | GIS= 5 (83%), BIM = 1 (17%), CAD = 5 (83%) |
| Contextual | GP,TT,JM,JD | 4 | 25% | Historical Documents = 4 (100%) |
| Sustainable | FM,AC,GP | 3 | 19% | EPW = 3 (100%) |
| Social | GP,JM,JD | 3 | 19% | Survey = 3 (100%) |
| Visual | TT,GP | 2 | 13% | GIS=2 (100%) Historical Documents = 2 (100%) |
| Functional | JD | 1 | 6% | Reports = 1 (100%) |
| Perceptual | TT | 1 | 6% | Social Media = 1 (100%) |
| Morphological | JD | 1 | 6% | GIS=1 (100%) |
4.2.2.3 Generation
This subsection highlights one finding regarding the generation step:
- 3D Models, Visual Programming Algorithms and Statistical Models are the most used data types during the generation step.
During the generation step, assumptions are generated using different pieces of data, which are generally represented in multiple data types. These pieces of data seek to address urban design concerns, thereby supporting the creation of design strategies and urban design narratives. Tables 4.16, 4.17, and 4.18 show the most adopted data types.
| Data.Type | Participants | Number.of.Participants | Perc.of.Participants |
|---|---|---|---|
| 3D Models | AC,AR,DB,DE,DL,FM,GP,JD,JM,LG,RS,TT | 12 | 75% |
| Visual Programming Algorithms | AC,DL,DE,FM,GP,JD,JM,TT,DB | 9 | 56% |
| Statistical Models | CB,AR,JM,RS,RT,TT | 6 | 38% |
| GIS Models | CB,DB,GP,JM,LG,RT | 6 | 38% |
| BIM Models | DB,DE,FM,GP,LG | 5 | 31% |
| Simulation Models | AC,FM,GP,JD,JM | 5 | 31% |
| Renderings | DE,DL,RS,TT | 4 | 25% |
| Diagrams | CB,DE,TT | 3 | 19% |
| VR Models | AC,DE,JD | 3 | 19% |
| Animations | DE,DL,RS | 3 | 19% |
| AR Models | AC,DE | 2 | 13% |
| Sketching | DB, | 1 | 6% |
| Scripting Models | JD | 1 | 6% |
| Data.Type | Participants | Number.of.Participants | Perc.of.Participants |
|---|---|---|---|
| 3D Models | AR,DB,LG,RS | 4 | 50% |
| Statistical Models | CB,AR,RS,RT | 4 | 50% |
| GIS Models | CB,DB,RT | 3 | 38% |
| BIM Models | DB,LG | 2 | 25% |
| Visual Programming Algorithms | DB | 1 | 13% |
| Diagrams | CB | 1 | 13% |
| Sketching | DB, | 1 | 13% |
| Animations | RS | 1 | 13% |
| Renderings | RS | 1 | 13% |
| Data.Type | Participants | Number.of.Participants | Perc.of.Participants |
|---|---|---|---|
| 3D Models | AC,DE,DL,FM,GP,JD,JM,TT | 8 | 100% |
| Visual Programming Algorithms | AC,DL,DE,FM,GP,JD,JM,TT | 8 | 100% |
| Simulation Models | AC,FM,GP,JD,JM | 5 | 63% |
| BIM Models | DE,FM,GP | 3 | 38% |
| VR Models | AC,DE,JD | 3 | 38% |
| GIS Models | GP,JM,LG | 3 | 38% |
| Renderings | DE,DL,TT | 3 | 38% |
| Diagrams | DE,TT | 2 | 25% |
| AR Models | AC,DE | 2 | 25% |
| Statistical Models | JM,TT | 2 | 25% |
| Animations | DE,DL | 2 | 25% |
| Scripting Models | JD | 1 | 13% |
Finding 10 reveals that most designers generate 3D models, as can be seen in Table 4.16. All participants from Group 2 use Visual Programming Algorithms during data generation, while in Group 1 only one participant uses this data generation method, as Tables 4.17 and 4.18 demonstrate. The importance of Visual Programming Algorithms in data-driven urban design processes is highlighted by this finding. Regarding participants from Group 1, half generate 3D Models and Statistical Models during this data generation process. This suggests that different methods and techniques of evidence-based approaches are used in both Group 1 and 2. For instance, while generating data using Statistical Models is a representative method for Group 1, it is only used by a quarter of participants of Group 2.
4.2.2.4 Visualisation
This subsection highlights one finding regarding the visualisation step:
11- Visual Programming and 2D Graphic Representation are the most used visualisation techniques.
Data visualisation is the step in which information is communicated as a visual output to all stakeholders. Finding 11 on data visualisation shows that Visual Programming and 2D Graphic Representation are used by more than half of the participants, as can be seen in Table 4.19. Group 1 tends to rely mainly on Rendering and Graphic Design, while Group 2 uses a more diverse range of visualisation techniques, as illustrated in Tables 4.20 and 4.21. Additionally, all participants from Group 2 mentioned Visual Programming as a visualisation technique.
Data visualisation is the step where the information is communicated as a visual output to all stakeholders.
| Visualisation.Technology | Participants | Number.of.Participants | Perc.of.Participants |
|---|---|---|---|
| Visual Programming | AC,JM,DE,DL,FM,GP,JD,TT | 8 | 50% |
| 2D Graphic Representation | DE,TT,CB,DL,GP,JM,LG,WG | 8 | 50% |
| Rendering | RS,AR,DE,GP,JD,LG | 6 | 38% |
| Virtual Reality | AC,DE,JD | 3 | 19% |
| Augmented Reality | DE,GP | 2 | 13% |
| Physical Models | TT,GP | 2 | 13% |
| Sketching | DB,RS | 2 | 13% |
| Animation | DL,JD | 2 | 13% |
| Visualisation.Technology | Participants | Number.of.Participants | Perc.of.Participants |
|---|---|---|---|
| Rendering | RS,AR,LG | 3 | 38% |
| 2D Graphic Representation | CB,LG,WG | 3 | 38% |
| Sketching | DB,RS | 2 | 25% |
| Visualisation.Technology | Participants | Number.of.Participants | Perc.of.Participants |
|---|---|---|---|
| Visual Programming | AC,JM,DE,DL,FM,GP,JD,TT | 8 | 100% |
| 2D Graphic Representation | DE,TT,DL,GP,JM | 5 | 63% |
| Virtual Reality | AC,DE,JD | 3 | 38% |
| Rendering | DE,GP,JD | 3 | 38% |
| Augmented Reality | DE,GP | 2 | 25% |
| Physical Models | TT,GP | 2 | 25% |
| Animation | JD | 1 | 13% |
4.2.3 Computational Tools
Data-driven urban design approaches and computational technologies were discussed in Chapter 2 of the Literature Review. These technologies were used as a guide to frame the technologies mentioned during the interviews. This section presents the technologies mentioned during the interviews and a SWOT analysis exploring designers’ perspectives on the use of computational tools. Two key findings are highlighted in this section:
12- Rhino and Grasshopper are the most used computational technologies during data-driven urban design processes.
13- Computational data-driven tools should improve data management usability, real-time analysis efficiency, pathways for data interpretation, and access to open data.
Finding 12 reveals that Rhino and Grasshopper were mentioned by more than half of the participants (see Table 4.22). This representation is largely due to Group 2, as can be seen by comparing Tables 4.23 and 4.24). This finding suggests that Visual Programming and CAD technologies are essential for Group 2 when undertaking data-driven urban design workflows.
| Computational.Tools | Technology | Participants | N.of.Participants | Perc.of.Participants |
|---|---|---|---|---|
| Grasshopper | Visual Programming Language | AC,DE,DL,GP,TT,FM,JM,JD,DB | 9 | 56% |
| Rhino | CAD | AC,DE,DL,GP,TT,FM,JM,JD,DB | 9 | 56% |
| AutoCAD | CAD | DL,TT,FM,JD,AR,RS | 6 | 38% |
| Revit | BIM | DE,GP,FM,JM,DB | 5 | 31% |
| Ladybug | Simulation (Environmental) | DE,GP,FM,JD | 4 | 25% |
| Sketchup | Geometry Processing | DL,FM,AR,LG | 4 | 25% |
| Honeybee | Simulation (Environmental) | GP,FM,JD | 3 | 19% |
| Archicad | BIM | GP,DB,LG | 3 | 19% |
| QGIS | GIS | JM,JD,DB | 3 | 19% |
| Unity | Game Engine | AC,DE | 2 | 13% |
| Enscape | Render Engine | DL,RS | 2 | 13% |
| InfraRed | Simulation (Environmental) | AC | 1 | 6% |
| Urbano | Spatial Data Analytics | AC | 1 | 6% |
| Adobe Suite | Image and Vector Manipulation | DL | 1 | 6% |
| Heron | GIS | GP | 1 | 6% |
| PedSim | Simulation (Behaviour) | GP | 1 | 6% |
| Galapagos | Optimisation | GP | 1 | 6% |
| Octupus | Optimisation | GP | 1 | 6% |
| InfraWorks | CAD | FM | 1 | 6% |
| Python | Programming Language | JD | 1 | 6% |
| Lumion | Render Engine | DL | 1 | 6% |
| CADmapper | CAD | FM | 1 | 6% |
| Google Earth | GIS | FM | 1 | 6% |
| SiteScan | GIS | LG | 1 | 6% |
| Geosampa | GIS | LG | 1 | 6% |
| ArcGIS | GIS | LG,RT | 1 | 6% |
| Urbit | Spatial Data Analytics | LG | 1 | 6% |
| Archistar | Spatial Data Analytics | RS | 1 | 6% |
| Excel | Data Analytics | RS | 1 | 6% |
| SPSS | Data Analytics | RT | 1 | 6% |
| Computational.Tools | Technology | Participants | Nu.of.Participants | Perc.of.Participants |
|---|---|---|---|---|
| AutoCAD | CAD | AR,RS | 2 | 25% |
| Sketchup | Geometry Processing | AR,LG | 2 | 25% |
| ArcGIS | GIS | LG,RT | 2 | 25% |
| Grasshopper | Visual Programming Language | DB | 1 | 13% |
| Rhino | CAD | DB | 1 | 13% |
| Revit | BIM | DB | 1 | 13% |
| Enscape | Render Engine | RS | 1 | 13% |
| Archicad | BIM | LG | 1 | 13% |
| QGIS | GIS | DB | 1 | 13% |
| InfraWorks | CAD | FM | 1 | 13% |
| SiteScan | GIS | LG | 1 | 13% |
| Geosampa | GIS | LG | 1 | 13% |
| Urbit | Spatial Data Analytics | LG | 1 | 13% |
| Archistar | Spatial Data Analytics | RS | 1 | 13% |
| Excel | Data Analytics | RS | 1 | 13% |
| SPSS | Data Analytics | RT | 1 | 13% |
| Computational.Tools | Technology | Participants | N.of.Participants | Perc.of.Participants |
|---|---|---|---|---|
| Grasshopper | Visual Programming Language | AC,DE,DL,GP,TT,FM,JM,JD | 8 | 100% |
| Rhino | CAD | AC,DE,DL,GP,TT,FM,JM,JD | 8 | 100% |
| AutoCAD | CAD | DL,TT,FM,JD | 4 | 50% |
| Ladybug | Simulation (Environmental) | DE,GP,FM,JD | 4 | 50% |
| Revit | BIM | DE,GP,FM,JM | 4 | 50% |
| Honeybee | Simulation (Environmental) | GP,FM,JD | 3 | 38% |
| Unity | Game Engine | AC,DE | 2 | 25% |
| Archicad | BIM | GP,DB | 2 | 25% |
| QGIS | GIS | JM,JD | 2 | 25% |
| Sketchup | Geometry Processing | DL,FM | 2 | 25% |
| InfraRed | Simulation (Environmental) | AC | 1 | 13% |
| Urbano | Spatial Data Analytics | AC | 1 | 13% |
| Enscape | Render Engine | DL | 1 | 13% |
| Adobe Suite | Image and Vector Manipulation | DL | 1 | 13% |
| Heron | GIS | GP | 1 | 13% |
| PedSim | Simulation (Behaviour) | GP | 1 | 13% |
| Galapagos | Optimisation | GP | 1 | 13% |
| Octupus | Optimisation | GP | 1 | 13% |
| InfraWorks | CAD | FM | 1 | 13% |
| Python | Programming Language | JD | 1 | 13% |
| Lumion | Render Engine | DL | 1 | 13% |
| CADmapper | CAD | FM | 1 | 13% |
| Google Earth | GIS | FM | 1 | 13% |
Groups 1 and 2 present their views about the main challenges related to the data-driven urban design processes.
According to the interviews, the main data-driven design challenges are related to governance and participatory processes. Besides that, time-changes, environmental issues, and a lack of open-data were mentioned.
“Climate related challenges” (AC - Group 2)
“Governance Challenges” (CB - Group 1)
“Sometimes we are in the city, and we just see something new, and we just don’t understand why it is happening and why we have it over there…So, I think it’s important that the community knows the reasons…and also the meaning…talking about placemaking, I think is important to talk also about the meaning of that place” (GP - Group 2)
“I think it has nothing to do with design in the end of the day. It’s just the correct effective way to deal with different stakeholders…it can be different communities…the government….the builders. This is so hard.” (TT - Group 2)
“I usually face this in the beginning of process…the lack of data…the lack of open data actually” (GP- Group 2)
Some challenges cited are not directly related to the design practice, but can have an impact on decision-making regarding design processes. For example, open data is about governance initiatives and stakeholder collaboration. Therefore, these challenges involve a set of complex factors related to the specificities of each field, such as governance management, company structure, and other factors.
Groups 1 and 2 were asked about strengths, weaknesses, opportunities, and threats (SWOT) for the current and future use of computational data-driven design tools. Table 4.25 shows the responses organised as a SWOT analysis matrix. As can be seen, Easy and Fast Management of Data, Knowledge Encapsulation, and Real-Time Analysis are considered strengths, while Computational Efficiency and the need for Expertise are considered weaknesses. Regarding the future use of computational tools, designers see availability of information and better data analysis as opportunities, and Interpretation of data and Lack of open data access as threats.
Finding 13 suggests that designers see Real-time analysis as a strength of computational tools; however, they have concerns about the Efficiency of computers in deploying computational analysis. Additionally, they claim that there is a demand for expertise to manage data, despite the strength of Easy and fast management of data.
Regarding opportunities and threats, similar antagonist scenarios from the SWOT analysis matrix are also accentuated. For instance, the designers highlight better data analysis as an opportunity, but Data interpretation is considered a threat; likewise, the Information availability is seen as an opportunity, contrasting with the Lack of open data access as a threat.
| Data.Driven.Design | SWOT | Concerns | Number.of.Participants |
|---|---|---|---|
| Current Practice | Strengths | Easy and Fast Management of Data | 3 |
| Knowledge Encapsulation | 2 | ||
| Real-Time Analysis | 2 | ||
| Code Reuse | 1 | ||
| Serendipity | 1 | ||
| Time Saving Mechanism | 1 | ||
| Weaknesses | Computational Efficiency | 3 | |
| Expertise Needed | 3 | ||
| Human-Computer Translation | 2 | ||
| Interoperability | 2 | ||
| Learning Curve | 1 | ||
| Algorithm Flexibility | 1 | ||
| Communication with Non-Experts | 1 | ||
| Future Practice | Opportunities | Information Availability | 7 |
| Better Data Analysis | 5 | ||
| Better Management | 1 | ||
| Better Data Presentation | 1 | ||
| Improving Collaboration | 1 | ||
| Threats | Open Data Access | 5 | |
| Open Data Accuracy | 4 | ||
| Data Interpretation | 3 | ||
| Data Management | 2 | ||
| Technology Implementation | 2 | ||
| Biased Data | 1 | ||
| Big Data Processing Time | 1 | ||
| Data Privatisation | 1 | ||
| Governance Interest | 1 | ||
| Uncertainty of Future Data | 1 |
The SWOT analysis accentuates that designers expect that data-driven urban design tools:
Improve the management of data through more user-friendly methods;
The real-time data analysis should be more efficient;
Improve data interpretation;
Include more access to open data.
4.3 Discussion
In the preceding section, the interview findings on the Design Process, Data-Driven Cycle, and Computational Tools were presented. Firstly, the Design Process subsection provided an understanding of how data-driven designers conduct urban design processes and the similarities and differences between them and traditional designers. Secondly, the Data Cycle subsection outlined the data steps of data-driven urban design and its relationship to computational technologies. Finally, the Computational Tools subsection presented the current computational tools used by designers and a SWOT analysis exploring designers’ perspectives in relation to the current and future use of computational tools.
Table 4.26 presents a summary enumerating the interview findings.
| Data.Driven.Design | Section | Interview.Findings | Findings.Index |
|---|---|---|---|
| Design Process | Formulation and Analysis | Both groups agree about the singularity of each urban design project in relation to its context | 1 |
| Each designer has their own approach to conduct project contextualisation | 2 | ||
| There is plurality of approaches on the use of themes for project contextualisation | 3 | ||
| Traditional Designers and Data-driven Designers tend to prioritise different urban design dimensions | 4 | ||
| Synthesis and Evaluation | The synthesis of an urban design project involves multiple contextualised design factors | 5 | |
| Visual Programming and Statistical Methods are the most used techniques during synthesis and evaluation steps | 6 | ||
| Documentation | Documentation in urban design process should have a narrative, engaging stakeholders, be simple, transparent and interactive | 7 | |
| Data Cycle | Gathering | Public and Open datasets are essential for data-driven urban design processes | 8 |
| Analysis | Spatial and Contextual are the most analysed urban design dimensions among both groups | 9 | |
| Generation | 3D Model, Visual Programming Algorithms and Statistical Models are the most adopted data type during data-driven design generation step | 10 | |
| Visualisation | Visual Programming and 2D Graphic Representation are the most used visualisation techniques | 11 | |
| Computational Tools | Tools | Rhino and Grasshopper were the most used computational technologies during data-driven urban design processes among participants | 12 |
| SWOT | Computational data-driven tools should improve data management usability, real-time analysis efficiency, ways for data interpretation, and access to open data | 13 |
Regarding the similarities and dissimilarities between data-driven and traditional designers, the findings highlighted that both groups follow similar steps during the urban design process and agree about the uniqueness of each urban design project in relation to its context. Also, the findings show that each designer conducts a project contextualisation in a particular manner. However, the findings also reveal that data-driven and traditional designers tend to focus on different dimensions of the urban design. Data-driven designers tend to build their narratives based on the availability of the computational tools, which consequently, can narrow their narratives, since there can be lack of computational tools addressing certain dimensions, such as visual perception and activity.
Beside the similarities and dissimilarities between data-driven and traditional designers, four main discussion points are highlighted from the thirteen interview findings. First, there is a need for systematisation of data-driven urban design processes. Even though design processes are singular, seeking a systematisation of those processes is crucial to provide a common structure of discussion to support evidence-based decisions. Additionally, a common structure can be beneficial for supporting distinct urban design narratives through a more transparent and explicit pathway to justify the prioritisation of themes among the plurality of potential choices. The combination of design process cognitive steps (Gero 1990; Gero and Kannengiesser 2004; Yu, Gu, and Ostwald 2021) with data cycle steps (Deutsch 2015; Runkler 2020; A. Liu, Wang, and Wang 2022) provides this common structure, in which the design decision-making processes can be tracked and made explicit regarding the data-design relationships.
Second, there is an importance for data diversity and open data access during data-driven urban design processes. As highlighted in the findings, the data-driven urban design processes are plural, regarding personal methods and different contexts. This plurality requires that designers have easy access to diverse datasets. A way to grant this requirement for designers is by providing open data access and a diverse set of tools that manage different types of data.
Third, computational tools shape urban design narratives. The findings highlighted that designers tend to narrow their urban narratives according to the available computational tools; consequently, the lack of tools covering specific urban design dimensions contributes to the overlooking of certain urban design dimensions.
Fourth, there is a need for the empowerment of data-driven designers as holistic digital toolmakers. The need for tools addressing specialised problems is pushing data-driven designers to become digital toolmakers (Ceccato 1999; Burry 2011). However, the findings show that data-driven designers tend to rely on proprietary tools that restrict users’ and toolmakers’ freedoms (Stallman 2002). If designers are agents of societal change (Gero 1990), from an holistic toolmaking perspective, the digital toolmaking process should also be understood as a social-political action, allowing the community to drive the advancements of technology, as a collaborative process of mutual agreement, neither dictated by nor dependent on software companies. This is only possible under Free and Open-Source community-based toolmaking development.
The following subsections highlight the four main points that drove the development of strategies for the conceptual framework of data-driven urban design processes and the computational design toolkit prototype.
4.3.1 The Needs for a Systematisation of Data-Driven Urban Design Processes
Despite the differences in epistemological approaches (Kummitha and Crutzen 2017) and personal preferences regarding urban themes, methods, and tools, systematisation for data-driven urban design processes is needed to support evidence-based decisions and facilitate transparent communication among stakeholders.
The Urban Design process is a creative and exploratory problem-solving activity, in which objectives and constraints are weighed and balanced in order to seek problem-solving resolutions (Carmona 2021). Interviews have highlighted that, although this process varies among designers, a common structure of cognitive design steps and data cycle steps can be constructed, approximating these singular approaches through a common data-driven urban design structure. This common structure is built by combining the cognitive design steps of the FBS Framework (Gero 1990; Gero and Kannengiesser 2004) and the data-driven cycle being adapted to an urban design context (A. Liu, Wang, and Wang 2022) (see Chapter 2 for details of the frameworks). This structure will be presented in the following subsections.
4.3.1.1 Formulation and Expected Behaviour (Gathering and Analysis)
In this step, designers gather and analyse relevant data to formulate potential urban design problems, identifying data relevant to the context and site according to their judgement.
“[…] First, we start understanding where you are, and then you start identifying the challenge of the particular location, culture, etc… then you identify methods and tools that you could be using to analyse specific points” (AC - Group 2)
“Separation of data from decision-making…and how you position yourself in the decision-making process […] Understanding how the place work has to be developed in a very critical way…what are the critical issues that drive the decision-making process in that place […]” (CB - Group 1)
The gathered data is analysed, trying to identify urban patterns that can be inferred as potential urban design problems, negotiating potential design solutions. According to the literature (Carmona 2002), these analysed data can be part of 8 data dimensions: Contextual, Morphological, Visual, Spatial, Sustainable, Perceptual, Functional, and Social. Some of these dimensions were identified during the interviews.
“I think it’s important to analyse it as a system. I try to analyse all the patterns that we have in urban design, their organizational lines and areas…this line can be also related so topography, hydrography also like rivers, ocean…the limits of the city. Something that I do as a strategy is overlaying different types of maps.” (GP - Group 2)
“Starting the analysis with structure plans, and then we propose a structure, which talks about the connectivity, like the land use mix, diversity…and then, we start developing (depending on the top project again) a build or a massing to understand what’s the density, the incomes of residential populations and dwellings, the commercial flow space, the kind of activity levels you would get, and feasibility ranges… It would enable us to deliver a development and typology in this specific area.” (JM - Group 2)
The problem-solution formulation in the design process involves establishing design requirements, goals, and expected behaviours (Gero 1990). Gero’s function-behaviour-structure (FBS) framework describes formulation as the process that transforms design requirements, which are described as a function (F), into an expected behaviour (Be) that will enable the function (Gero and Kannengiesser 2004).
It is important to understand design problem-solution formulation in the context of the data-driven cycle (A. Liu, Wang, and Wang 2022), as data are an integral part of the data-driven design process. The functional requirements will inform which type of raw data should be gathered. The data analysis process shapes the information that will guide the design requirements and goals, informing whether additional raw data should be gathered. This iterative process is the problem formulation proposed by Gero’s FBS framework, including the data-driven cycle, as Figure 4.1 shows. The problem formulation provides inputs for the function (F) in the definition of specific goals, as well as informing the expected behaviour (Be) of the Structure (S).
The enabling technologies, data types, and urban dimensions used during this process, which were cited in the interviews, are presented in Tables 4.13, 4.14, and 4.15.
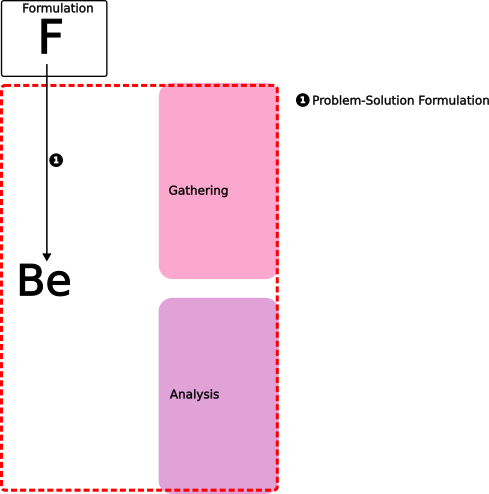
Figure 4.1: Formulation and Expected Behaviour (Gathering and Analysis)
4.3.1.2 Synthesis, Analysis-Structure and Evaluation (Analysis and Generation)
In this step, designers explore potential design solutions based on the previous formulation. Through an iterative and exploratory process, they generate potential solutions according to analyses and evaluations. As outlined in the FBS framework (Gero 1990), this process involves synthesis, analysis, and evaluation. The formulated design problem will inform the Expected Behaviour (Be) that is synthesised into a Structure (S), which is a potential solution. The Behaviour of the Structure (Bs) is then analysed against the Expected Behaviour (Be), as an Analysis of the Structure, evaluating how the Behaviour of the Structure (Bs) performs. Designers and Data-Driven Designers iteratively negotiate between the problem and solution several times during the design process, while they are exploring design alternatives (Lawson 2006).
“Procedures stages are critical…You need to be able to get back and checks…but you must get backend check if you have satisfied the key issues that you identified before, checking if you must reconsider or reorganise the key issues …(design is an iterative process). But you just know when you are in the process.” (CB - Group 1)
“From my experience, I think you can use data more as a constant check of options…a constant check of decisions…it may be just a constant check of the constraints, right? […] I do see data as providing a bunch of options, and it is able to do it in a fairly quick way. Then, the architect begins to play with the output …modifying and maybe running analyses and doing their feedback loop until they get a product out.” (DE - Group 2)
The formulated requirements and design goals are synthesised into new pieces of generated data (a design proposition) that seeks to answer the requirements and design goals. The behaviour of these pieces of data is evaluated as a potential solution (BS) against the expected behaviour (Be) (Evaluation). The data cycle follows an iterative pattern of Analysis -> Generation -> Analysis, until the requirements and design goals are fulfilled, and one or more design solutions are chosen.
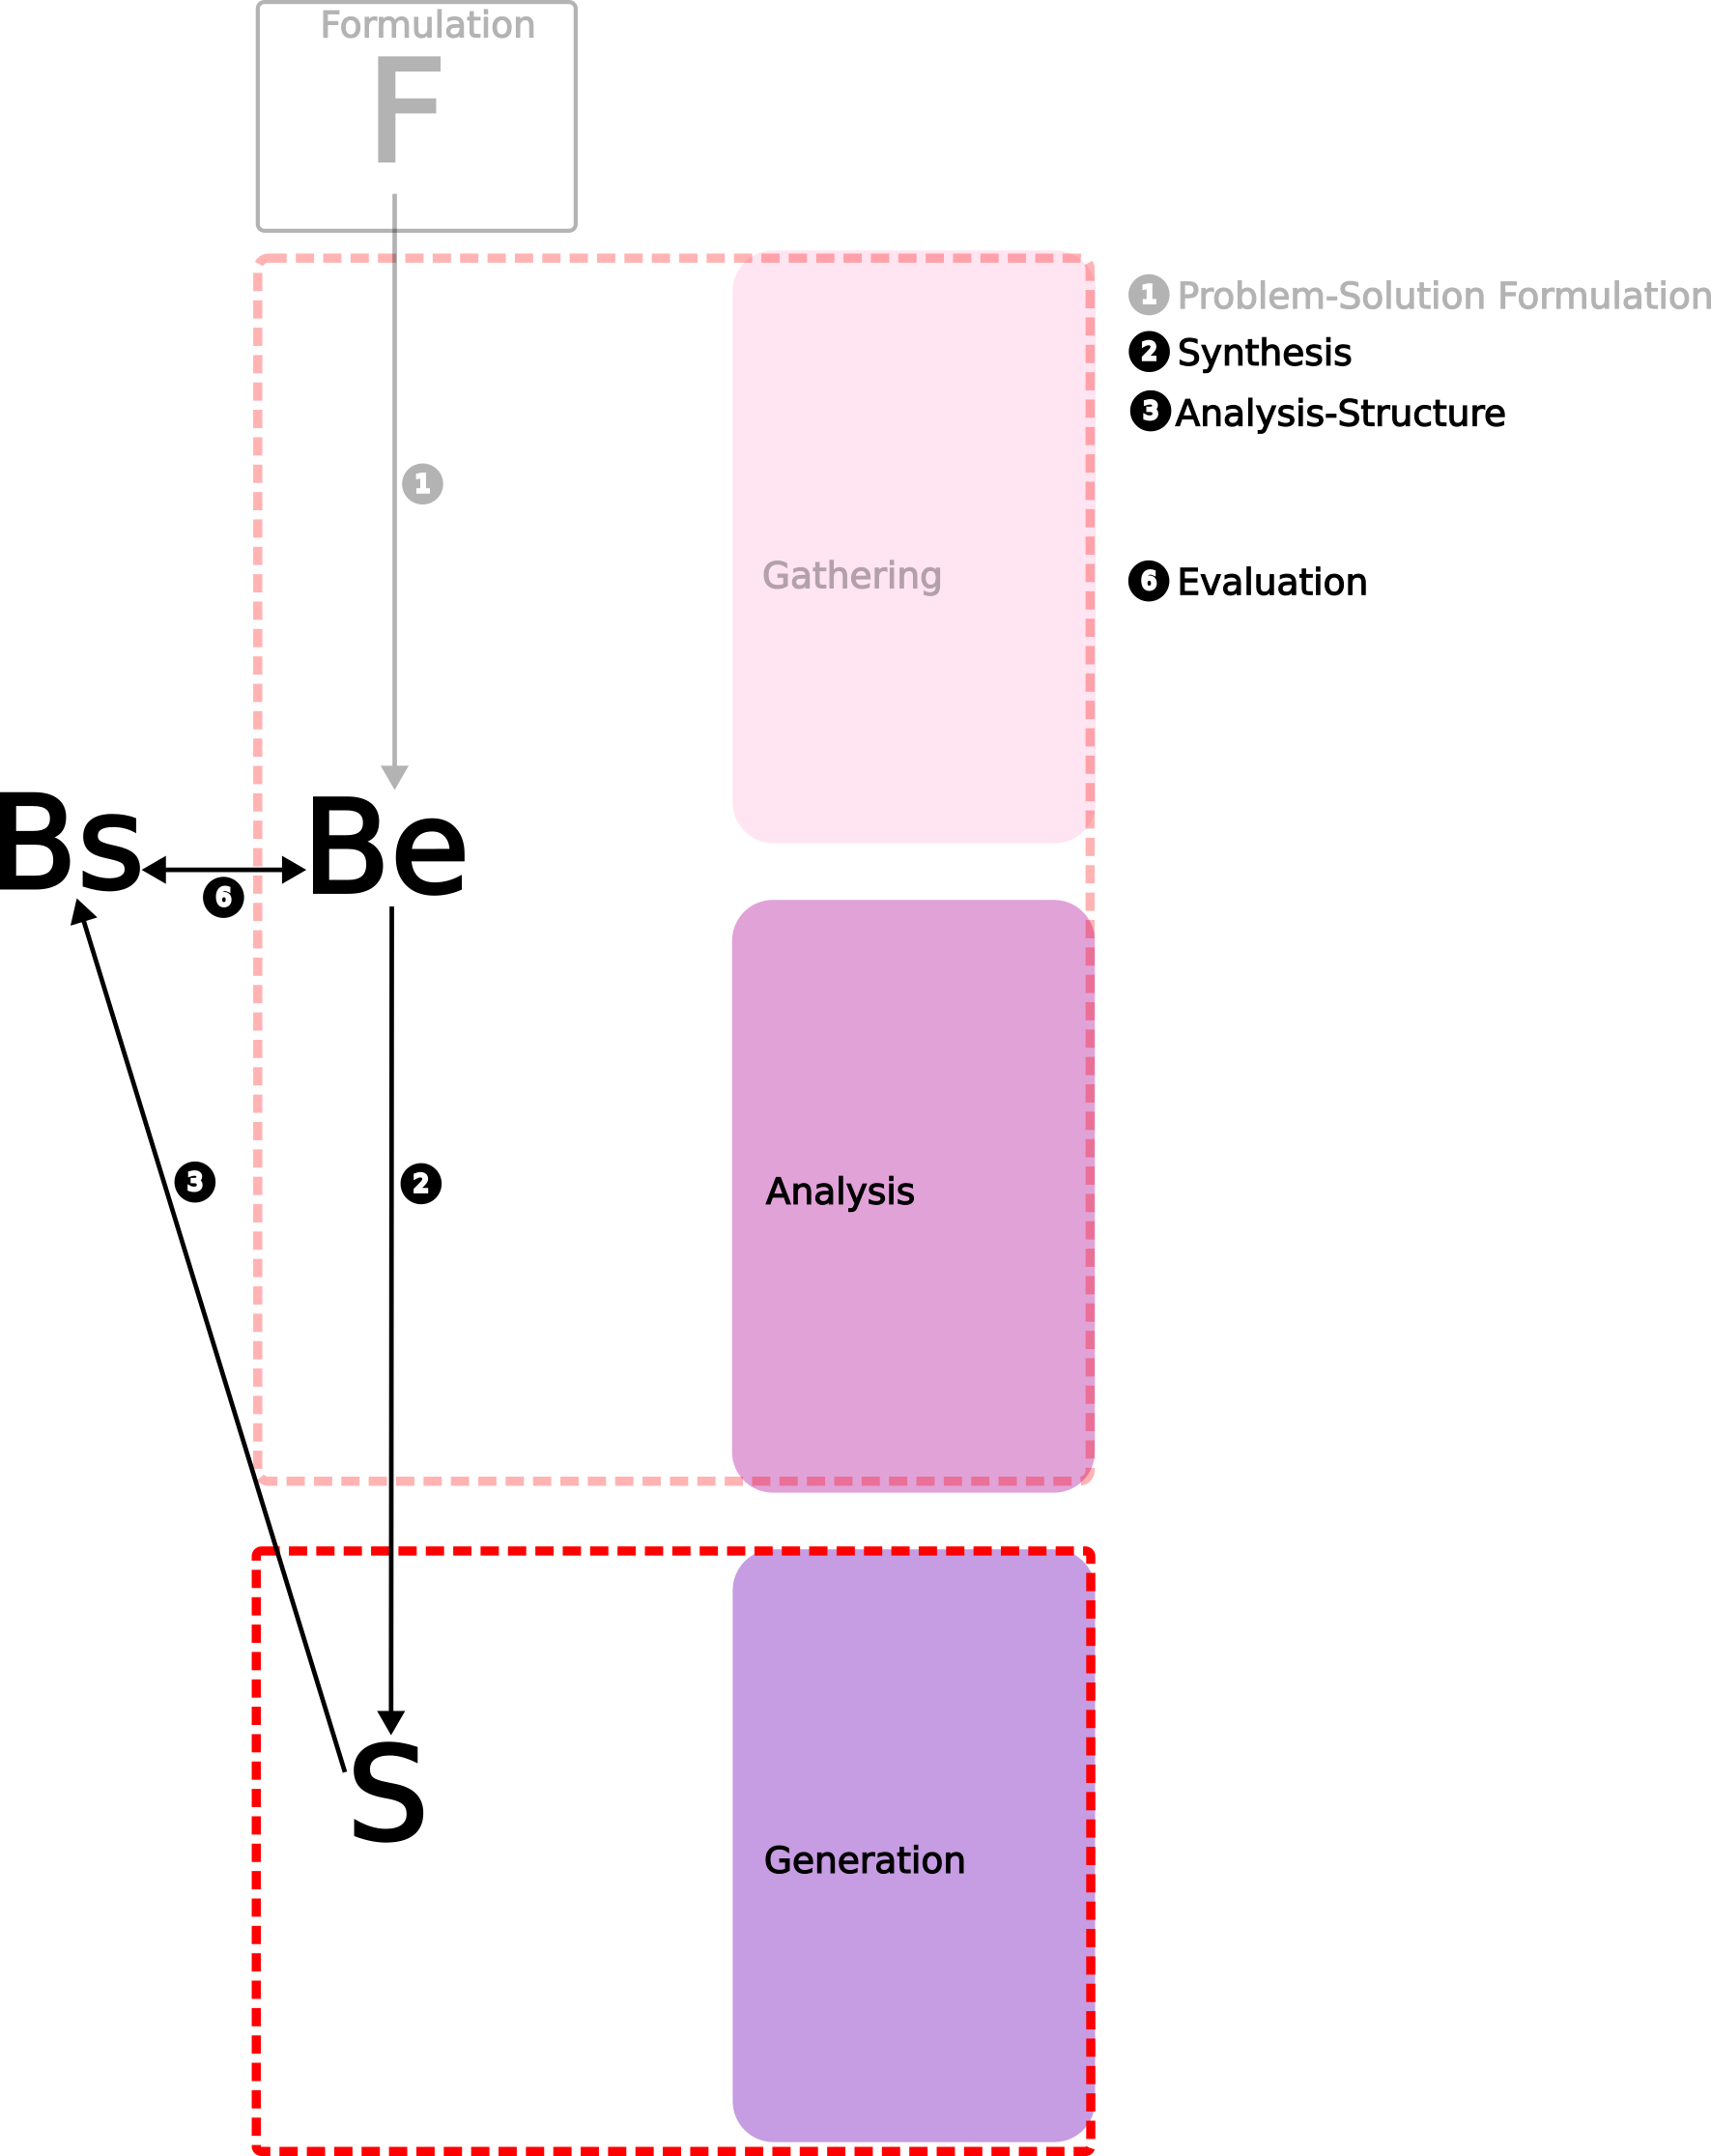
Figure 4.2: Synthesis, Analysis-Structure and Evaluation (Analysis and Generation)
4.3.1.3 Documentation (Visualisation)
In this step, designers prepare the chosen solutions to be communicated as design descriptions (Gero and Kannengiesser 2004). These descriptions can vary in distinct media formats, such as 3D models, text, images, graphs, diagrams, and other mediums. During the interviews, designers mentioned a diverse range of visualisation technologies, as Tables 4.19, 4.20, and 4.21 show. In a data-driven design cycle, the generated data is organised to build an urban design narrative through documentation.
In a traditional design process, the documentation is a final step in which the final design (Structure) is already defined, and its purpose is to communicate the final design outcomes through a graphical narrative. On the other hand, the interviews’ findings suggest that the documentation step in data-driven design processes should be based on five principles: Interactivity, Narrative, Simplicity, Engagement, and Transparency. The interactivity during the documentation of the data-driven process inverts the traditional design process’ rationale, since the traditional design process documentation is a static snapshot of the final design solution, while in data-driven design it is an interactive (and iterative) ongoing process of representations of potential solutions. Therefore, the documentation step in data-driven design has more representativeness than traditional design processes, since the data-driven process adds an extra layer of analysis on top of the Behaviour Structure (Analysis-Documentation) through the analysis of the documentation.
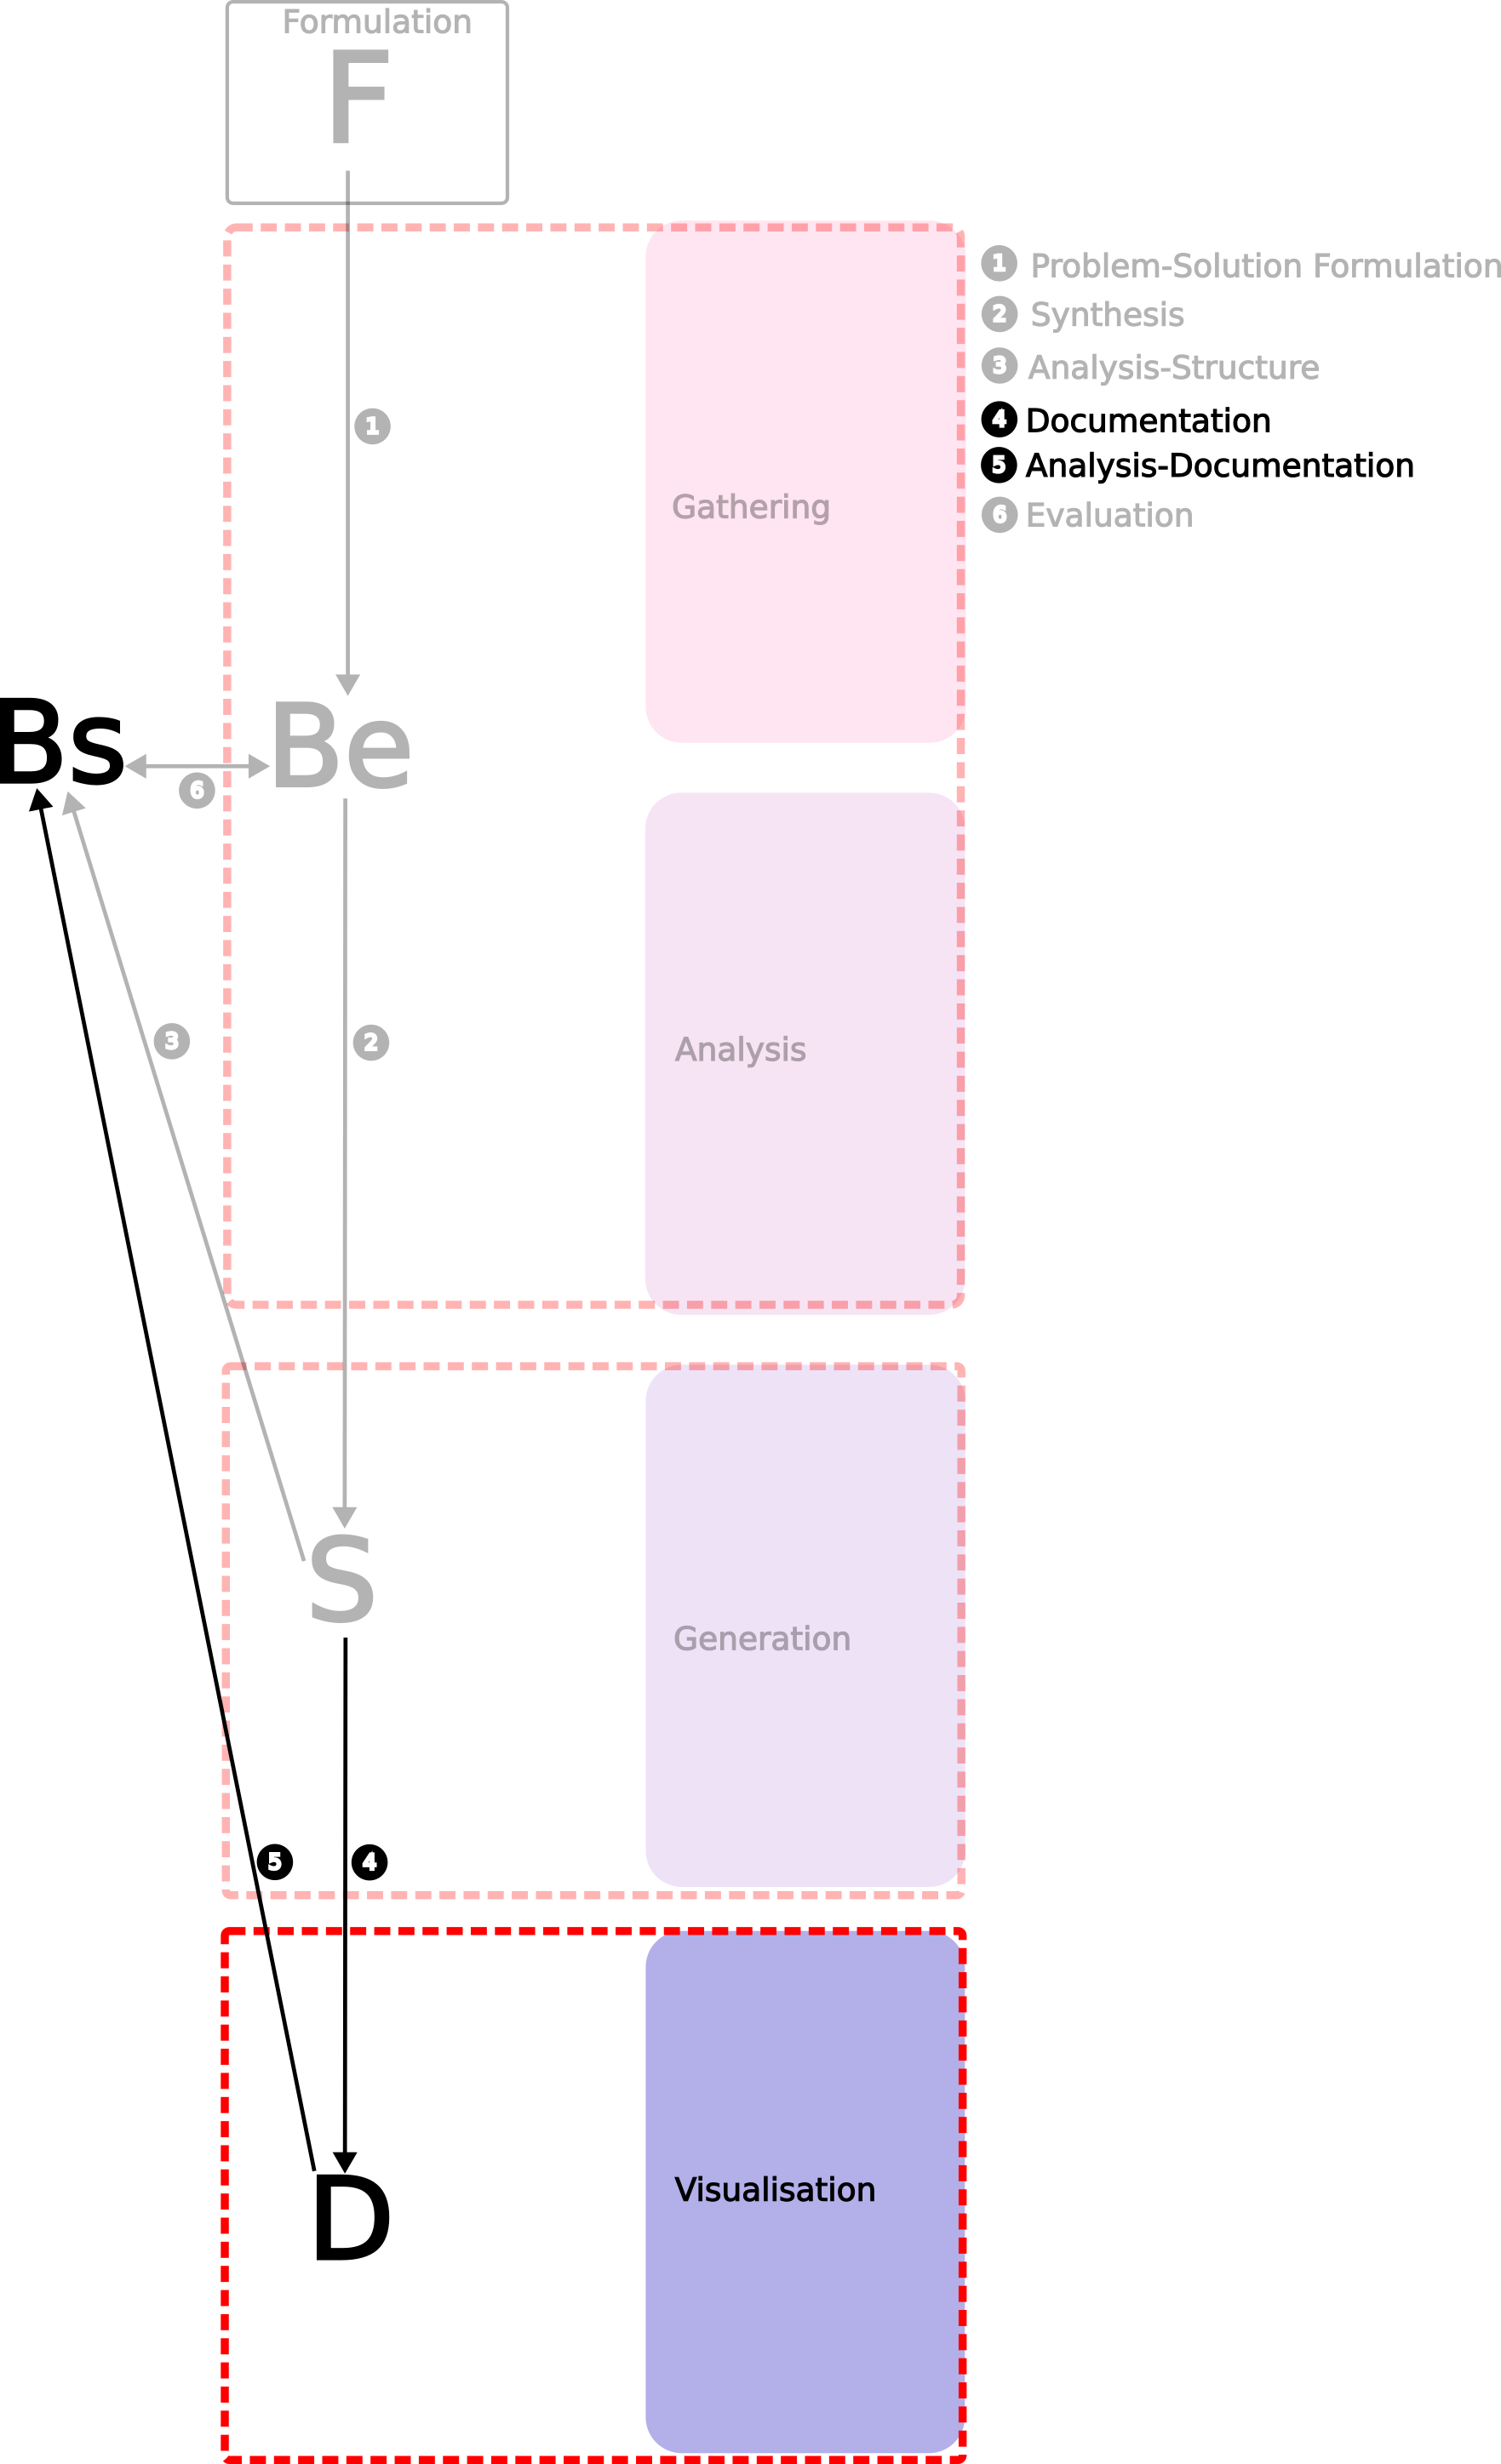
Figure 4.3: Documentation and Analysis-Documentation (Visualisation)
4.3.1.4 Reformulations in Data-Driven Urban Design Processes
As discussed in the previous subsection, the documentation process has an extra role in data-driven urban design processes, influencing the decision-making of the ongoing project. Consequently, this new role opens the possibility of additional design reformulations during the evaluation process, compared with traditional design processes.
In traditional design process evaluation, designers can pass through three different problem-solution reformulations: Structure Reformulation, Behaviour Reformulation, or Function Reformulation (Gero 1990). Structure Reformulation involves changes made to the design solution variables (S) (parameters of the design solution that should change). Behaviour Reformulation involves changes made to the Expected Behaviour (Be) (how the design solution is expected to perform should change). Function Reformulation involves changes made to the design function (F) (the design solution purpose should change). These three types of reformulations occur when the Solution Behaviour (Bs) is evaluated as unsatisfactory.
In a data-driven urban design process context, the interviews’ findings suggest that there are five potential reformulations. First, Structure Reformulation coming from Documentation (R1), which is the documentation informing that the parameters of the design solution should change. Second, Structure Reformulation coming from Structure (R2), which is the current Structure informing that the parameters of the design solution need to change. Third, Behaviour Reformulation coming from the Structure (R3), which is the change coming from Structure informing how the design solution is expected to behave. Fourth, Behaviour Reformulation coming from Documentation (R4), which is the change coming from Documentation informing how the design solution is expected to behave. Fifth, Function Reformulation (R5), which in data-driven design comes from Documentation, since the new final step that influences the decision-making process in data-driven design is the Documentation. The Function Reformulation informs that the purpose of the design should change.
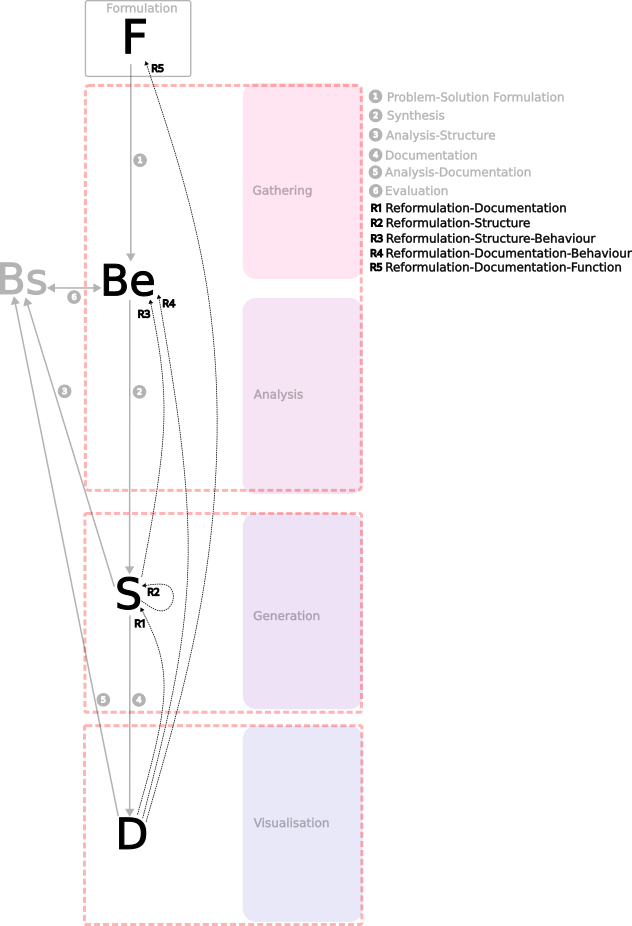
Figure 4.4: Reformulations in Data-Driven Urban Design Processes
4.3.2 The Importance of Data Diversity and Open Data Access
Due to the uniqueness of each urban design project, gathering a diverse range of datasets containing different data types is needed. The literature review shows that the urban design process is a complex problem-solving task involving consideration of multiple dimensions (Carmona 2002, 2021; Boyko, Cooper, and Davey 2005; Batty 2013b), and every project requires a combination of different datasets across multiple technologies to negotiate the design problem-solution and build the urban narrative. The singularity of the urban design process was corroborated during the interviews by participants of both groups and can be noted by the number of urban design themes cited by both traditional and data-driven designers, as shown in Tables 4.6, 4.4, and 4.5. It exposes that a diverse range of datasets, enabling technologies for data gathering, and easy availability of data are needed. Since finding, selecting, and processing the right pieces of data is crucial to support the success of an urban design problem-solution proposition.
Table 4.27 summarises the relationship between the urban design dimensions, themes, and types of data cited during the interviews.
| Urban.Design.Dimension | Themes | Data.Type…Technology | Cited.by.Group.1 | Cited.by.Group.2 |
|---|---|---|---|---|
| Contextual | History, Cultural | Historical Documents | x | x |
| Morphological | Character, Urban Form, Spatial Analysis | GIS, Historical Documents | x | x |
| Visual | History | GIS, Historical Documents | x | x |
| Spatial | Spatial Analysis | GIS,BIM,CAD | x | |
| Sustainable | Environmental | EPW | x | |
| Perceptual | Activity, Place | Survey | x | |
| Functional | Strategic Plans, Economic, Infrastructure. Feasibility | Reports | x | |
| Social | Demographics, Public Realm, Security, Activity | Survey, Census, GIS | x |
The gathering of a diverse range of data is facilitated by the availability of open data. The interviews revealed that open data plays a critical role in providing easy access to data in data-driven urban design processes, as demonstrated in Tables 4.10, 4.11, 4.12, and 4.25.
4.3.3 The Computational Tools Shaping Urban Design Narratives
The interview findings highlight that data-driven designers tend to focus on urban design dimensions, based on the availability of computational tools. As previously cited, the success of an urban design project depends on finding and selecting the right pieces of data that will support the project. However, the interview findings suggest that data-driven designers tend to build urban narratives based on the availability of computational tools. This pattern can be observed by comparing the urban themes mentioned by both groups. While data-driven designers tend to focus more on Environmental and Spatial Analysis topics, which are covered by popular computational design toolkits, traditional designers explore themes that computational toolkits are lacking, such as Visual Perception and Activity. These interview findings suggest that toolkit availability may contribute to the low percentage of data-driven designers (as shown in Table 4.5), addressing Visual Perception and Activity during contextual analyses compared with traditional designers (as shown in Table 4.4), which accentuates the need for toolkits covering overlooked urban design subjects.
Moreover, the interview findings highlight that Visual Programming and 3D Models have a crucial role during the data-driven generation step, since all the interviewed data-driven designers use both technologies to generate data.
The interview findings also indicate that traditional designers and data-driven designers use different tools to build urban design narratives. Traditional designers (Group 1) tend to generate more information regarding statistical models than data-driven designers (Group 2). Table 4.24 shows that no statistical tools were mentioned by Group 2. These findings suggest a need in data-driven design for the integration of statistical tools into parametric environments, which can enhance statistical analysis feedbacks to inform design generation.
Visual Programming is the core technology used by data-driven designers. However, concerns regarding its complexity during stakeholder communication were mentioned, suggesting that new strategies to improve Visual Programming, making stakeholder communication simpler, should be explored by new toolkits.
Data-driven designers should overcome these barriers, exploring overlooked urban design dimensions to make stronger and more holistic urban design projects.
Two actions can be explored to start to overcome these barriers. The first short-term action is the development of tools and approaches covering overlooked urban design dimensions. This action can start to fill the gap as a short-term solution. However, developing a tool for each overlooked urban design dimension is not the definitive solution, since new datasets, file types, computational tools, urban problems, and requirements appear every day. The city is not a static system nor are technological advancements. The second action, which can be considered a long-term solution, is proposing an environment in which data-driven designers can develop and improve their own specific tools, adjusting them as needed. This action understands and supports data-driven designers as digital toolmakers (Burry 2011).
4.3.4 The Need for Empowerment of Data-Driven Designers as Holistic Digital Toolmakers
As previously mentioned, the need for digital toolmakers in urban design is crucial to overcome the barriers between data-driven tools and specific urban design requirements. However, the current tools and toolmaking in the field are predominantly based on proprietary solutions, and there is a lack of free and open-source software tools environments for data-driven urban design.
If the toolmaking process frees the digital user from the predefined software functions (Burry 2011), from a proprietary software perspective, this freedom is restricted and unidimensional, since the use, modification, and sharing are restricted by licence agreements.
Toolmaking using proprietary software is restricted because the software modifications are limited and framed by the company creator. For instance, it is possible to create scripts in Grasshopper or Dynamo to interact with Rhino or Revit core components using Software Development Kits; however, changing core components of these pieces of software is not possible, since the source code is not available.
Also, toolmaking using proprietary software is unidimensional, since the modification, use, and sharing of the software are limited by licensing agreements. For instance, in a hypothetical scenario where the software binary was modified through reverse engineering to enhance features that could benefit a community of users, this modified version cannot be redistributed legally among the community. The only one who can benefit legally in this scenario is the person who made the changes, consequently, the social and political impact is none, since no technological advancements or social and political benefits are returned to society. An holistic toolmaking approach should consider the social-political impacts of the toolmaking process.
The interviews’ findings show that data-driven designers rely heavily on one single proprietary visual programming tool (Grasshopper), as shown in Table 4.24. Even though there are different visual programming tools available for several pieces of design software, such as Revit-Dynamo, Blender-Sverchok, Sketchup-VIZ, and Archicad-PARAM-O.
Although Rhino-Grasshopper has a strong community that collaborates in creating plug-ins that facilitate data-driven design workflows, as discussed above, the crucial aspects of digital toolmaking for data-driven urban design should consider an holistic understanding and principles of an integrated view of smart cities’ development. These holistic and integrated views can only be achieved through Free and Open-Source Development.
Free and Open-Source Development is based on four main principles (Stallman 2002):
The freedom to run the software, for any purpose;
The freedom to study and adapt the software for one’s own needs;
The freedom to redistribute the software;
The freedom to improve the software and to release these improvements for the community.
In short, Free and Open-Source Software (FOSS) makes available source and object code, empowering users with the freedom to use, modify, and redistribute original and altered codes (Y. Qiu 2017). It is essential to empower and engage citizens as potential agents of technology advancements, considering the social and political dimensions of the digital toolmaking process, contributing to support the so-called “smart people” to flourish (Vestergaard, Fernandes, and Presser 2015). Allowing data-driven designers to become holistic digital toolmakers, developing and improving their own tools, is essential. Moreover, allowing society to participate as active agents of technological advancements should be the ultimate goal of every new piece of technology developed for a smart city (Roche et al. 2012; Stratigea, Papadopoulou, and Panagiotopoulou 2015; Vestergaard, Fernandes, and Presser 2015). However, this is only possible under a FOSS community-based software development environment, in which people can participate and collaborate on pieces of software as a community.
The next section will present the development strategies that were developed based on the discussion points.
4.4 Conceptual Framework Development and Computational Toolkit Development Strategies
In the previous subsection, the four main discussion points were presented:
The Need for a Systematisation of Data-Driven Urban Design Processes
The Importance of Data Diversity and Open Data Access
The Computational Tools Shaping Urban Design Narratives
The Need for Empowerment of Data-Driven Designers as Holistic Digital Toolmakers
These four discussion points guide the development of the framework and computational toolkit.
First, the need for systematisation of Data-Driven Urban Design Processes is addressed in the framework. The proposed framework adapts the cognitive steps of the design process using the FBS Framework (Gero 1990; Gero and Kannengiesser 2004; Yu, Gu, and Ostwald 2021), relating these steps with data-driven steps (Deutsch 2015; Mathers 2019; Runkler 2020; A. Liu, Wang, and Wang 2022), and computational technologies including data and design tools. The FBS Framework and data-driven steps were discussed in subsection 4.3.1. A mapping from the developed conceptual framework, including data and design tools, is presented in Chapter 5 after the discussion of the strategies for the development of the computational toolkit. The conceptual framework provides the overall structure for computational toolkit development. Additionally, the conceptual framework seeks to support evidence-based decisions and more transparent communication among stakeholders.
Second, the concerns regarding data diversity, open data access, computational tools shaping urban design narratives, and the empowerment of data-driven designers as holistic toolmakers are addressed in the computational toolkit development, reflecting both technical and philosophical aspects of the development. This includes the integration of datasets, design and data tools, and holistic digital toolmaking development of a computational toolkit.
The integration of datasets, design and data tools addresses: a) data diversity, supporting the multiple file types that are integrated into a Visual Programming Environment; b) open data access, connecting data gathering processes with open source services, such as OpenStreetMap and Mapillary.
Holistic digital toolmaking development addresses: a) the computational tools shaping urban design narratives, as the computational toolkit development holistically seeks to include tools that can potentially explore overlooked urban design dimensions, such as Visual and Perceptual dimensions. It is also developed as a Free and Open Source Software, in which it is expected to receive inputs from the community of users, including and requesting new features; b) the need to empower data-driven designers as holistic digital toolmakers, since the computational toolkit is developed using only Free and Open Source Tools and it is proposed as a piece of Free and Open Source Software. Thus, the development seeks to address the social and political agenda of a community-driven development, supporting data-driven designers to use, modify, and share the computational toolkit according to their own or community needs.
The next subsections further discuss the development strategies of the framework and computational toolkit.
4.4.0.1 Systematisation of Data-Driven Urban Design Processes
The interviews’ outcomes demonstrate that data-driven designers follow common steps during an urban design proposition. These steps have been systematised into a preliminary framework for data-driven urban design processes, as Figure 4.5 illustrates. This framework adapts design processes from (Gero 1990; Gero and Kannengiesser 2004; Yu, Gu, and Ostwald 2021), as well as data-driven urban design steps (Deutsch 2015; Mathers 2019; Runkler 2020; A. Liu, Wang, and Wang 2022). The next step is to define computational technologies to support data-driven urban design processes.
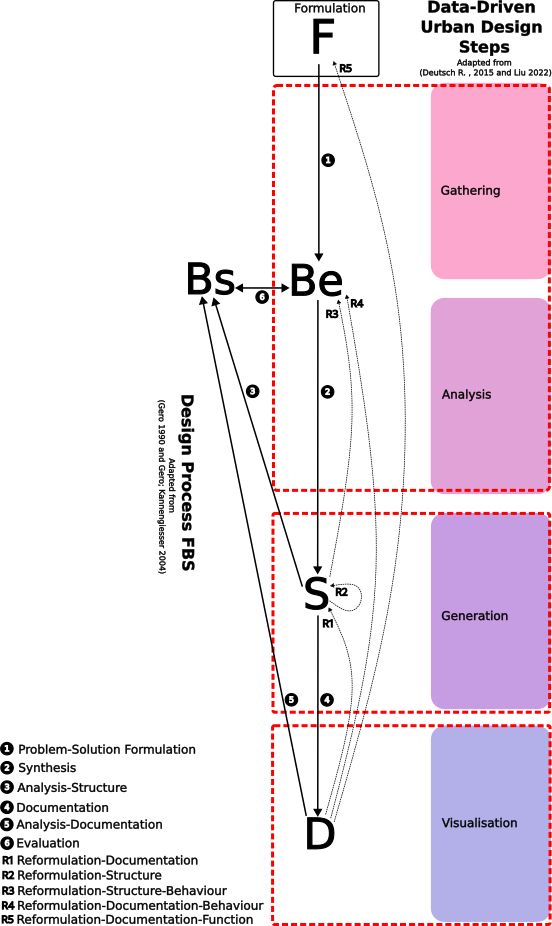
Figure 4.5: Preliminary Framework for Data-Driven Design Processes
There are several new and innovative technologies that have been identified in the literature (Batty et al. 2012; Batty 2013a; Schuurman et al. 2012; Al Nuaimi et al. 2015; Bosch et al. 2017; Jamei et al. 2017; Alvear et al. 2018; Hammoudeh and Arioua 2018; Rajab and Cinkelr 2018; Yagol et al. 2018; Allam and Dhunny 2019; Oliveira Neto et al. 2019; Purohit and Kumar 2019; Xie et al. 2019; Chowdhury et al. 2020; W. Li, Batty, and Goodchild 2020; Ullah et al. 2020; Stojanovski et al. 2020; Yuan et al. 2020) that can be implemented and explored to assist urban design processes. However, it is crucial to start by first implementing core technologies that can assist essential dimensions for urban design processes, and then implementing technologies that cover overlooked urban design dimensions, supporting the creation of more diverse urban design narratives. According to Tables 4.22, 4.23, and 4.24, the core and lacking features are, respectively:
Core: CAD, GIS, and Visual Programming;
Lacking Features: Data Analytics Integration, Spatial Data Analytics Tools, and Simple Interactive Communication Tools.
Simulation (Environmental) and BIM tools were also cited as core technologies; however, there are FOSS projects in development for Blender/Sverchok, such as Ladybug-Blender, Topologic-Sverchok, and IFC-Sverchok, which address these areas. These technologies could potentially be integrated with the proposed tools, thus extending their capabilities for creating urban design narratives even further.
4.4.0.2 Integrating Datasets, Design and Data Tools
One of the most essential tasks in data-driven urban design processes is integrating datasets from various sources. Urban design necessitates that designers have an holistic view of the city, incorporating multiple urban design dimensions into the design process, which typically involves working with multiple data types and different software applications, thus complicating design workflows due to the lack of interoperability and integrated analysis to inform design.
Data and design tools are both important for design. However, data tools tend to be third-party pieces of software that are not integrated into the design process, compromising interoperability and slowing down the workflow of the real-time response between data and design.
“The weakness in the software, there is no unique software tool today…so you basically give many different tools…so the biggest problem is the integration between. It’s difficult there’s no single platform, it’s difficult to integrate them…the kind of tools that we do, and use tend to be very sophisticated… so you need to use the tool to interpret and to gather the data or if you feed the data into the tool to help regenerate a design brief, right? Then it’s one tool, and then the tool to generate the CAD solution is another tool… the tool to the simulation is another tool, and then optimisation, and so on….so basically you get a wide array of tools, and they are not integrated at all…that is the biggest challenge […] So, gathering information, interpreting information, and integrating information to design process. So, the specific barriers are you know there’s no such thing yet.” (JD)
The interview findings and recent literature suggest that both data and design are essential for better supporting evidence-based and data-driven urban design processes (Deutsch 2015; Mathers 2019; Kvan 2020). The integration of both data and design tools can potentially enhance real-time feedback and interoperability of data-driven urban design processes. The core technologies and expected features are presented in the following subsection.
4.4.0.2.1 Holistic Toolmaking Development for a Computational Toolkit.
Designers are becoming creators of their own tools (Frazer 1995; Ceccato 1999; Burry 2011), and the processes and products of design are becoming more collaborative (Kvan 2000; Gero and Kannengiesser 2004). In this scenario, data-driven designers, as digital toolmakers, are socially and politically responsible for the use and development of design tools, as their choices can restrict who is allowed to participate in these processes and products. Furthermore, the extensibility of computational tools in proprietary environments is restricted by the tool’s manufacturers, setting limits on use, modification, and sharing (Stallman 2002).
The proposed data-driven tools were created using Free and Open-Source libraries, and the entire source code of the proposed tools can be accessed and modified. The computational toolkit is designed to be extensible, and its modular approach based on data-driven steps, data and design tools. The design of the cognitive steps of design processes does not limit the potential demands that the community of data-driven designers may have for specific tasks or urban narratives.
4.4.0.2.2 The Computational Toolkit Requirements
The core technologies found in the literature and interviews that are crucial for the data-driven urban design process are:
CAD
GIS
Visual Programming
The lacking features during data-driven urban design process are:
Data Analytics Integration
Spatial Data Analytics Tools
Simple Interactive Communication Tools.
Essentially, CAD and GIS technologies are used to gather, analyse, and generate spatial data, as can be seen in Table 4.13. The CAD file formats vary according to software package used; however, there are some open standard formats for vector data that can be interchangeable between different pieces of software, such as Drawing Interchange Format (.dxf) and Scalable Vector Graphics (.svg). The CAD formats are important to quickly represent and manipulate geometric vector-based data; however, they lack associated layers of information in comparison with other formats, such as GIS and BIM file formats. Regarding GIS, there are two essential file types used: raster and vector data. There are several interchangeable file formats for vector and raster data, for instance shapefile (.shp,.shx,.dbf), and GeoJSON (json) for vectors, and Geographic Tagged Image File Formats or GeoTIFF (.tif) and Digital Elevation Models (.dem) for raster data. Each of these file formats provides a specific type of information during the urban design process. For example, the shapefile file format provides geo-referenced geometries associated with different sets of information (such as demographic, land use, socio-economic, infrastructural, etc.), GeoJSON is similar to shapefile regarding the information that it carries, but it is organised as a different data structure JavaScript Object Notation (.json) that is easily integrated in web environments. Regarding raster data, for example, the GeoTIFF file format is used to provide geo-referenced satellite image information, while digital elevation models also provide geo-referenced images, but add numerical elevation information associated with pixels and are generally used to build and analyse topographic models.
The shapefile is a proprietary file format developed by the Environmental Systems Research Institute (ESRI), but openly documented (ESRI 2008). It is one of the most adopted GIS vector file formats, widely used across different GIS pieces of software, as the literature shows (Zhu, Wang, and Wang 2018; Zhu et al. 2019) and the interviews highlighted (see table 4.22). The popularisation of toolkits for Parametric Tools has facilitated the integration of GIS data into design workflows, such as Urbano, Heron, MerkatGIS, itTools, among others, some of which were cited during the interviews, as shown in Table 4.22.
These tools provide read features for vector data rather than using shapefiles or an OpenStreetMap file format (.osm), which is an open format written in Extensible Markup Language (.xml). However, generally these tools lack raster data features. Also, apart from OpenStreetMap, which is an open format, these tools do not provide translations from shapefiles to other open formats, such as Geopackage (.gpkg), which is a full open source, non-proprietary, platform-independent replacement for shapefiles developed by the Open Geospatial Consortium (OGS). The use of open formats is important to provide reliable interoperability across different software packages and environments, for instance, with the popularisation of new web-based environments for Geo Spatial Analysis and Data-Driven Design, such as Mapbox, Celsium, Archistar, and Giraffe. Therefore, it is important that a data-driven urban design tool have support for both vector and raster data and facilitate interoperability through open formats and support for translation from closed to open formats.
As previously mentioned, visual programming tools are essential for creating and integrating data during data-driven urban design processes, as Table 4.22 shows. However, the interview outcomes highlight the need for a diverse range of data types to address concerns across multiple urban design dimensions, and the lack of specialised tools addressing some of these dimensions can limit the development of urban design narratives. These outcomes suggest a demand for new developments supporting neglected urban design dimensions, such as Activity and Built Form analysis (perceptual and morphological dimensions), as Table 4.5 indicates.
Moreover, the interview outcomes show that statistical analysis tools are lacking in 3D Modelling/Visual Programming tools used by data-driven designers, and since statistical analysis is an essential method for data-driven design, it should be included.
Another concern is that visual programming is an essential approach to provide interactive communication with other stakeholders; however, understanding visual programming is not easy or clear for those who are not used to it, blurring the transparency and simplicity of communication with stakeholders. To address this concern, other technologies could be explored alongside parametric design, translating parameters and geometric representation in real-time to a more user-friendly environment such as interactive web-based environments like Giraffe, Scout, and Digital Blue Foam, with bidirectional communication between the parametric environment and the web-browser. However, to respect privacy and support security, freedom, and grant control of computation for the user (Stallman 2002), it is important to be able to build these channels of communication running as a local server, making this feature non-dependent on contracts based on Software as Services (SaaS). Another possibility could be combining parametric design with VR and AR technologies. This combination could provide interactivity from parametric design and engagement, comprehension, and simplicity from an immersive experience coming from VR technology.
Despite all the technical concerns, the lack of community-based developed urban design tools is a barrier to empowering people as active agents of technological changes and advancements. This concern should be addressed with the development of Free and Open-Source tools dedicated to data-driven urban design processes.
The four data steps presented in the preliminary framework (Figure 4.5) suggest a modular approach for the toolkit development, in which there should be dedicated tool sets for each stage: gathering, analysis, generation, and visualisation. The following subsection presents the proposed tools and a justification for the four steps.
4.4.0.2.3 Computational Toolkit Rationale
Gathering
Regarding the gathering step, GIS technology is one of the most important technologies that provides data for multiple urban design dimensions. Therefore, it is essential to have support for shapefiles, since data providers make data available through this file format. Additionally, it is important to provide translation and support for other open formats such as gpkg, osm, and geojson, in order to grant interoperability and openness for the developed toolkit. Furthermore, it is crucial to provide a connection with the OpenStreetMap API to directly gather spatial data directly into the design platform. Moreover, to support raster files, the toolkit should be connected locally with a web-browser environment, in which GIS satellite imagery is more easily integrated through public API datasets, such as the Earth Engine Catalog. To address neglected urban design dimensions, alternative sources of data collection are explored, such as web service data and street imagery data, as the literature review shows (N. C. Chen, Nagakura, and Larson 2016; Fu et al. 2018; Steentoft et al. 2018; Ye et al. 2019; W. Qiu et al. 2021), to explore perceptual and morphological urban design dimensions using data analytics methods. Finally, for a more comprehensive approach to gathering, additional file formats could be added to further extend the data analysis and generation, such as support for Comma Separated Values (.csv) and JavaScript Object Notation (.json) files for generic data manipulation.
Analysis
For the analysis step, the interview outcomes show that analyses generally vary from correlations among different datasets to inferred insights about a problem-solution urban design issue, mathematical methods based on graph analysis regarding street networks, environmental analysis, and qualitative analyses of reports and historical documents, as Table 4.27 shows. Considering the interview outcomes and the urban design dimensions from the literature review, the data analysis tools are based in two categories: spatial analysis tools and data analytics tools. These two categories together can provide tools that support analyses across the eight urban design dimensions.
For instance, the public realm can be potentially analysed using integration analysis (Hillier and Hanson 1989; Hillier 2007; Carmona 2021), distances between places and transportation through the shortest path, comparison between multiple modals to reach a specific place by time using the shortest path by time, correlations and regressions to show and predict relationships between features of the urban environment, and segmentation to analyse visual and perceptual properties of the urban environment, such as complexity and image, using street imagery.
Even though the proposed tools are limited in terms of the number of analysis methods and do not saturate the possible methods and tools across urban design dimensions, it is a first step towards an integrative and holistic data-driven urban design approach. Furthermore, these analytical methods can be combined with other available toolkits, such as Ladybug Tools for environmental simulations, Topologic for topological relationships between elements, and Blender BIM for BIM modelling, as part of a free software ecosystem of data-driven design.
Generation
Regarding the generation step, as the interview findings show, this process is generally carried out using Visual Programming, as shown in Table 4.24. Because Sverchok is a visual programming language with several built-in geometric functions, fewer tools are proposed in this step, since the available built-in tools can be used in combination with the proposed tool. However, essential tools to manage data and geometry are proposed in this step.
Data-driven designers are free to choose geometries, parameters, simulations, and optimisation functions and combine them to create their own parametric/generative system that better suit their needs, according to the urban design task they are trying to address.
Visualisation
The visualisation step is where urban design outcomes are externalised from the designer’s conceptualisation and presented to other stakeholders. According to the interview outcomes, this step requires interactive, simple, and transparent communication among stakeholders. Results show that visual programming is essential to create an interactive process, but it is not easily communicated. Additionally, data analysis needs to be presented using appropriate visualisation methods. Therefore, the proposed tool implements a WebVR real-time geometry connector to visualise parametric relationships in a WebVR environment. This feature seeks to provide a simpler interactive environment for communication among stakeholders. Furthermore, the proposed tool will provide plotting methods from different chart types, based on Python seaborn, since all pieces of information from the data analytic process should be presented in high-quality graphs for better communication. Finally, interactive web-based plotting will be integrated to provide interactive graph visualisation, for the creation of dashboards and a simplified environment for parametric communication. This feature will be implemented using Streamlit and leafmap.
Table 4.28 presents the proposed computational toolkit.
| Data.Driven.Cycle | Technologies | Category | Purpose | Tools |
|---|---|---|---|---|
| Data Gathering | GIS | Design Tool | Geographic Data Gathering | Download OpenStreetMap data |
| Data Gathering | GIS | Design Tool | Geographic Data Reading | Read GIS (Shapefile, gpkg, GeoJSON) |
| Data Gathering | GIS | Design Tool | Geographic Data Reading | Read DEM (Digital Elevation Models) |
| Data Gathering | GIS | Design Tool | Geographic Data Reading | Read LAS (Point Clouds) |
| Data Gathering | Data Analytics | Data Tool | Data Reading | Read CSV (Comma Separated Values) |
| Data Gathering | Data Analytics | Data Tool | Data Reading | Read JSON (Javascript Object Notation) |
| Data Gathering | Data Analytics | Data Tool | Data Structuring | Pandas Series |
| Data Gathering | Data Analytics | Data Tool | Data Structuring | Pandas Dataframe Creation |
| Data Gathering | Data Analytics | Data Tool | Data Structuring | Split String |
| Data Gathering | Spatial Data Analytics | Design Tool | Geographic Data Gathering | Download Street Network Graph |
| Data Gathering | Web Services | Supporting Tool | Web Downloader | Download Data URL |
| Data Gathering | Web Services | Supporting Tool | Web Downloader | Request Data API |
| Data Gathering | Web Services | Design Tool | Streetscape Imagery Gathering | Download Street Imagery |
| Data Analysis | Image Classification | Data Tool | Data Classification | Panoptic Segmentation |
| Data Analysis | Image Classification | Data Tool | Data Classification | Instance Segmentaton (Object Detection) |
| Data Analysis | GIS | Design Tool | Geographic Analysis | DEM Analyses |
| Data Analysis | GIS | Design Tool | Geographic Analysis | Whitebox GIS Tools Integration |
| Data Analysis | Data Analytics | Data Tool | Data Exploration | Exploratory Data Analysis (EDA) |
| Data Analysis | Data Analytics | Data Tool | Data Correlation | Data Correlation |
| Data Analysis | Data Analytics | Data Tool | Data Prediction | Regression Models |
| Data Analysis | Spatial Data Analytics | Design Tool | Spatial Analysis | Isovists |
| Data Analysis | Spatial Data Analytics | Design Tool | Spatial Analysis | Network Analyses |
| Data Analysis | Spatial Data Analytics | Design Tool | Spatial Analysis | Shortest to Path |
| Data Generation | GIS | Design Tool | Geographic Transformation | Latitute/Longitude to Points |
| Data Generation | GIS | Supporting Tool | Filetype Transformation | File to GeoDataframe |
| Data Generation | GIS | Supporting Tool | Filetype Transformation | File to GeoJSON |
| Data Generation | Geometry Processing | Design Tool | Geometric Transformation | Faces from Vertices |
| Data Generation | Data Analytics | Data Tool | Data Filtering | Pandas Filter |
| Data Generation | Data Analytics | Data Tool | Data Mapping | Pandas Map Features |
| Data Generation | Data Analytics | Data Tool | Data Transformation | Transpose Dataframe |
| Data Generation | Data Analytics | Supporting Tool | Filetype Transformation | CSV File to Pandas |
| Data Visualisation | GIS | Design Tool | Geographic Visualisation | Dashboard Map |
| Data Visualisation | Geometry Processing | Design Tool | Geometric Visualisation | Dashboard 3D |
| Data Visualisation | Data Analytics | Supporting Tool | Dashboard Creation | Dashboard Creation |
| Data Visualisation | Data Analytics | Data Tool | Content Description | Dashboard Markdown |
| Data Visualisation | Data Analytics | Data Tool | Textual Data Visualisation | Dashboard Dataframe |
| Data Visualisation | Data Analytics | Data Tool | Graphical Data Visualisation | Dashboard Create Plot |
| Data Visualisation | Data Analytics | Data Tool | Graphical Data Visualisation | Seaborn Plot |
| Data Visualisation | Web Services | Supporting Tool | Web Server Creation | Dashboard Server |
| Data Visualisation | Web Services | Supporting Tool | Web Server Creation | Python Server |
| Data Visualisation | Immersive Technologies | Design tool | Immersive Visualisation | Dashboard WebVR Connector |
4.5 Conclusion
This chapter presented thirteen semi-structured findings and their discussions. These findings were organised into three development strategies, which combined the interview findings with the theoretical and conceptual discussion of the literature review:
Systematisation of Data-Driven Urban Design Processes;
Integration of Datasets, Design and Data Tools;
An holistic development of a Computational Toolkit.
This chapter presents the strategies that guided the development of an integrated approach for data-driven urban design processes, both in terms of a framework and a computational toolkit. Firstly, it provides the theoretical and conceptual background for its development, including the systematic development of the framework composed of an adaptation of the FBS Framework (Gero 1990; Gero and Kannengiesser 2004; Yu, Gu, and Ostwald 2021) for cognitive steps of urban design processes, data-cycles and procedures regarding urban design processes (Deutsch 2015; Mathers 2019; Runkler 2020; A. Liu, Wang, and Wang 2022), and the core enabling computational smart technologies (GIS, Data Analytics, Spatial Data Analytics, Web Services, Image Classification, Geometry Processing, and Immersive Technologies) (Maguire 1991; Alonso et al. 2004; Botsch et al. 2010; Grekousis 2020; Runkler 2020; Dieck, Jung, and Loureiro 2021; Byerly, Kalganova, and Ott 2022) with data and design functions. Secondly, the development strategies presented the technical requirements for the development of the computational toolkit prototype, including its procedures, categories, purposes and functions.
The next chapter will present the Computational Development Phase, including the development of a computational toolkit and a scenario to demonstrate its use.