Hello Sverchok
Nowadays, Parametric and Generative Design is getting popular. There are available several pieces of software developed by different companies, such as Rhino/Grasshopper (McNeel), Revit/Dynamo (Autodesk), Archicad/Param-o (Graphisoft), Sketchup/Viz-Pro (Trimble), Microstation/Generative Components (Bentley). However, almost all options are proprietary software.
We have a great free option for those computational design software. It is a plug-in for the well-known Blender called Sverchok.
This tutorial is a brief introduction to Sverchok. The examples will be more AEC related, but can the general principles explained can be applied in other fields as well.
Installation
First, download and install Sverchok on your machine. Go to Sverchok GitHub page and download sverchok-master or use this link here. Then, in Blender, go to Edit -> Preferences -> Add-ons -> Install an add-on and choose the file svechok-master zip file. Check up the Sverchok box to activate it and save preferences.
Set up the Environment for Sverchok
In this next step, we are going to set up the Sverchok working environment. This is not mandatory, but it is convenient to use two monitors or a dedicated area to work with Sverchok.
With the Sverchok Layout selected, go to Layout Workspace and duplicate, then rename it to “Sverchok”. After that, go to timeline viewport and hold Shift+Mouse Left Button, dragging it outside the Blender window. It will make a new Blender window with the timeline, then you change the timeline window to Sverchok. After that, you can split the original timeline in two and set one as Text Editor. We are going to check Sverchok geometry values on it.
Keep the other timeline as default because it will help you to visualise parametric changes through animations.
Also, you can minimise the N tab on the Sverchok window and maximise Blender windows with Crtl+spacebar to gain a little more space to work.
Finally, you can set up to visualise nodes icons under the Edit -> Preferences -> add-ons -> Sverchok -> General -> Display icons only toggle box. Save this configuration under File -> Defaults -> Save Startup File. It will make the changes persistent to your system with a dedicated layout to work with Sverchok.
First Steps
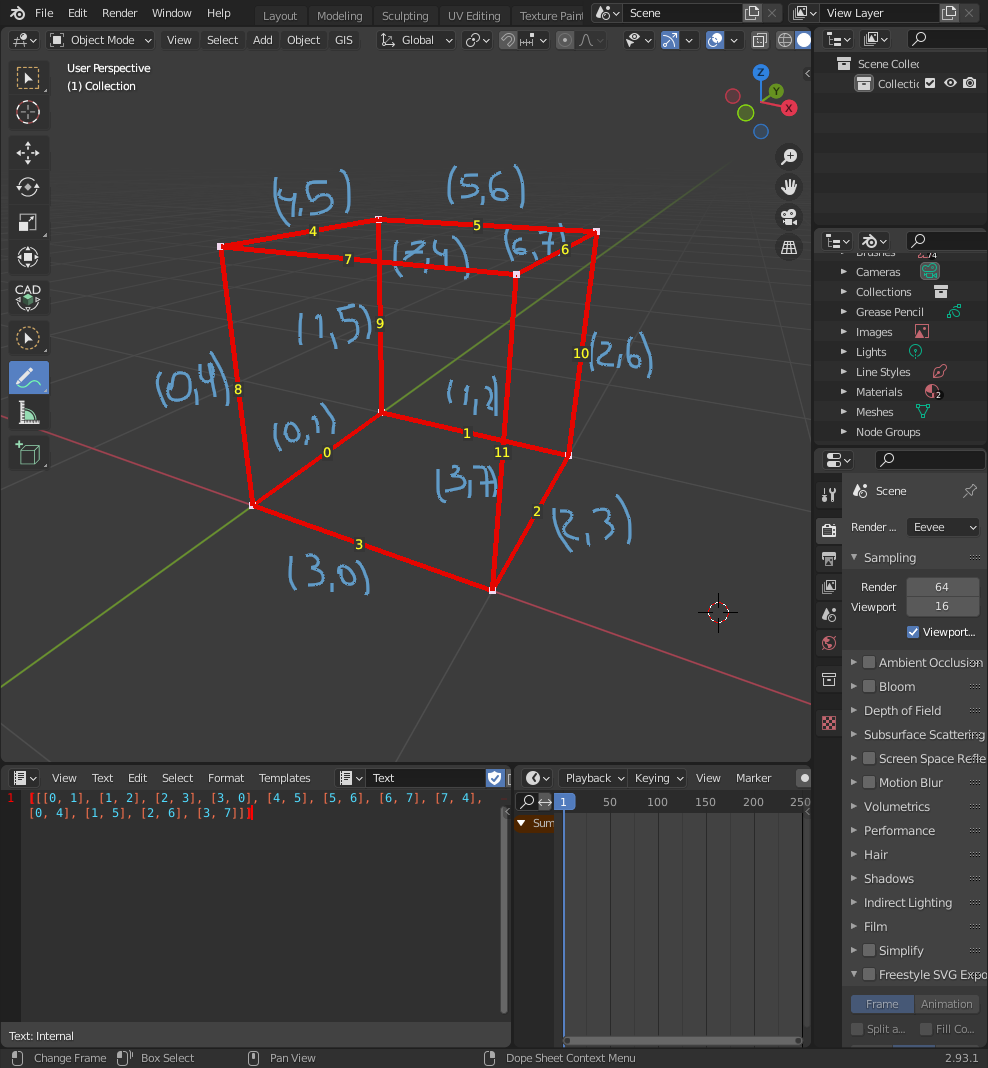
First of all, we need to understand how Sverchok understands and manipulates geometries. The basic geometry in Sverchok is composed of vertices, edges, and polygons.
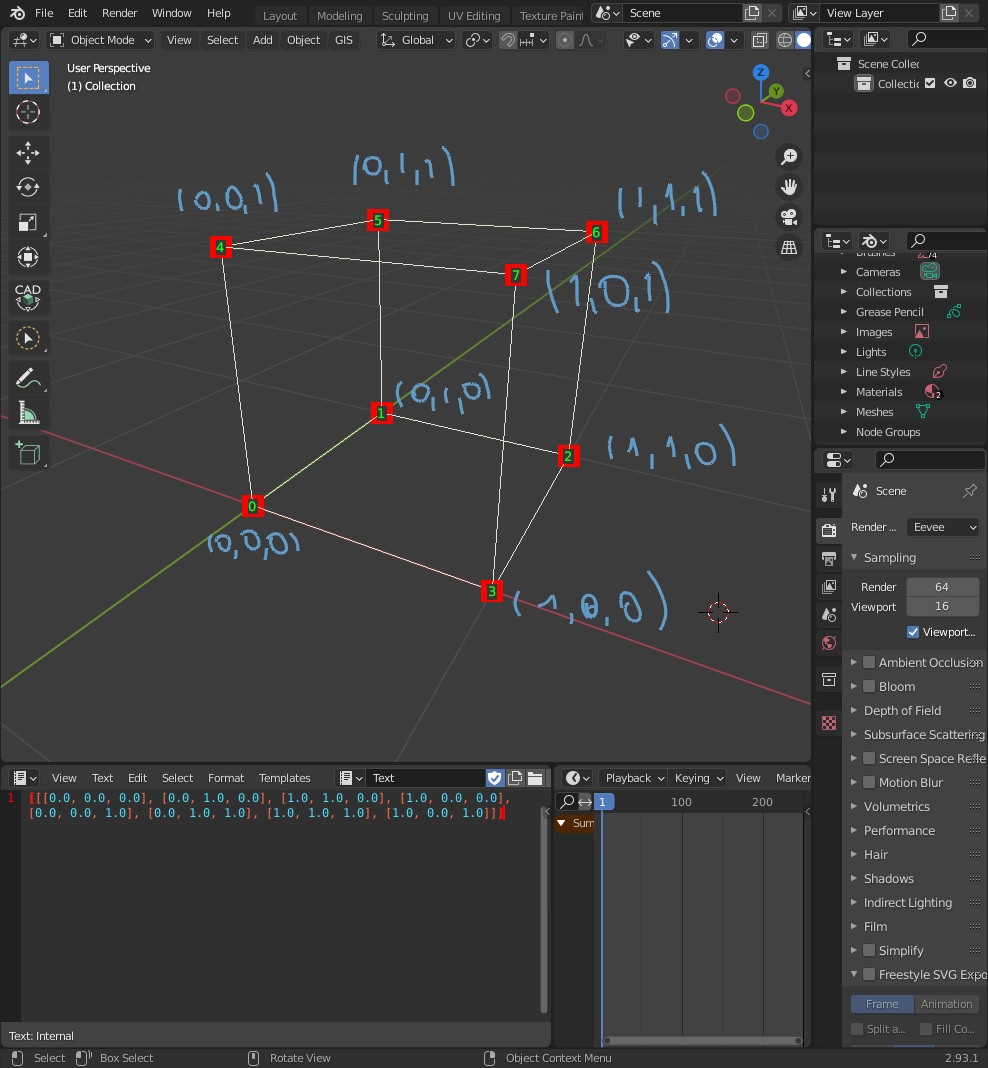
Edges paired vertices. In the case of our Cube the pairs will be 12 pairs of vertices: (0,1),(1,2),(2,3),(3,0),(4,5),(5,6),(6,7),(7,4),(0,4),(1,5),(2,6),(3,7) as shown bellow:
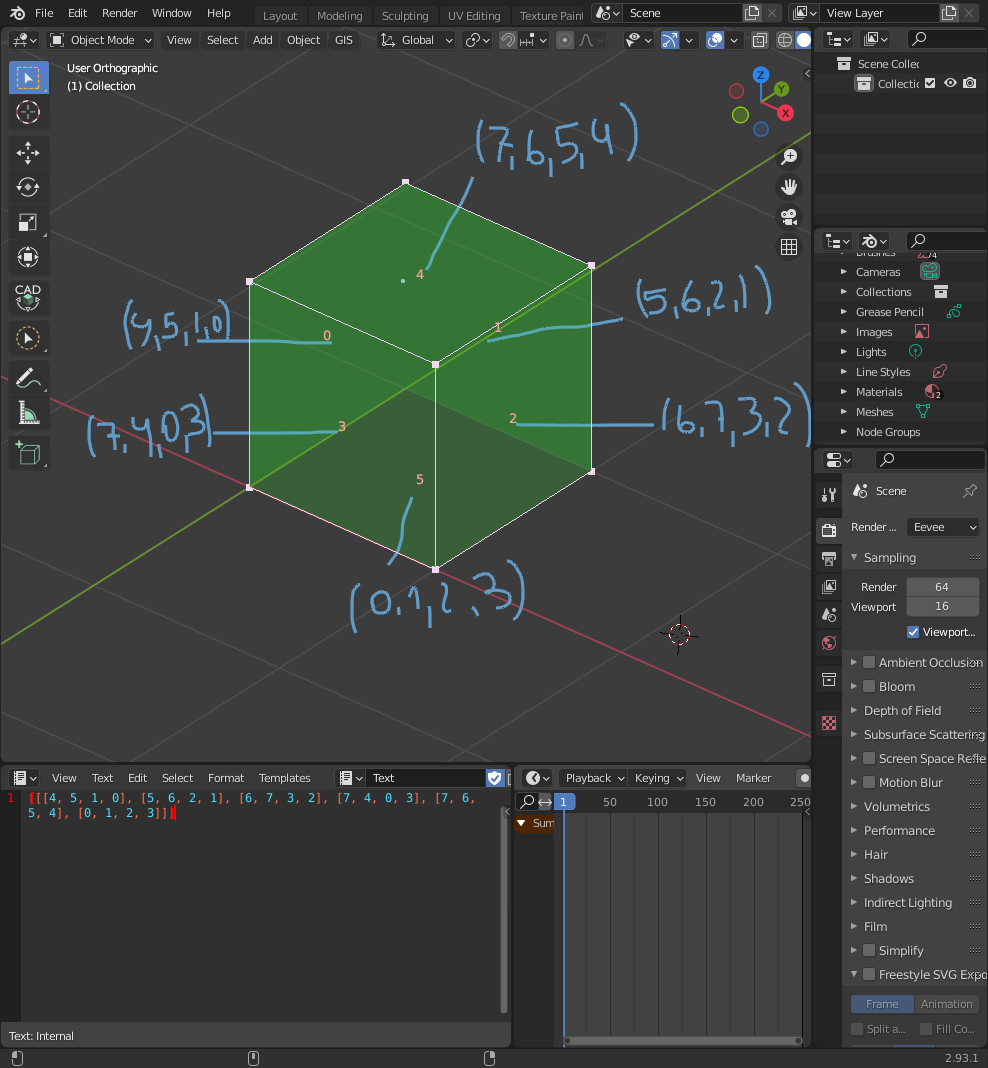
Finally, there are faces, which are groups (commonly composed by 3 or 4 elements) of edges. Using the Cube as example, there are 6 faces: (4,5,1,0),(5,6,2,1),(6,7,3,2),(7,4,0,3),(7,6,5,4),(0,1,2,3).
Lists
Vertices, edges, and faces are stored in Lists as in Python Lists.
Lists are data structures that store elements in an ordered manner.
For example, we can have a list of colours composed of four elements: “red”, “blue”, “yellow”, and “purple”. In Python, it will look like as shown below:
my_list_of_colours = ["red","blue","yellow","purple"]
We can access each element using an index number representing the “address” of a specific number in a list as an integer.
Indexes in Python and Sverchok start counting from the number 0.
For example in the previous example my_list_of_colour, the first element red has the index 0, blue index 1, yellow index 2, purple index 3.
To access an element in a list, you can use its corresponding index in square brackets as shown:
my_list_of_colours[0] # This access colour red
my_list_of_colours[1] # This access colour blue
my_list_of_colours[2] # This access colour yellow
my_list_of_colours[3] # This access colour purple
For instance, if we use our previous described box (1,1,1) the corresponding vertices, edges, and polygon as Python list will be:
`vertices = [(0,0,0),(0,1,0),(1,1,0),(1,0,0),(0,0,1),(0,1,1),(1,1,1),(1,0,1)]``
In Sverchok, the data structure used to represent vertices is tuples. Tuples is an immutable data structure differing from lists that is mutable. A tuple can not be changed after its creation. However, inside Sverchok nodes, those data structures will be managed for us for now, and we do not need to worry about it.
edges = [ [0,1],[1,2],[2,3],[3,0],[4,5],[5,6],[6,7],[7,4],[0,4],[1,5],[2,6],[3,7] ]
Edges lists are represented as paired vertices lists.
polygons = [ [4,5,1,0],[5,6,2,1],[6,7,3,2],[7,4,0,3],[7,6,5,4],[0,1,2,3] ]
Polygons lists are lists of vertices index that describes a specific polygon. A polygon implicit carries edge information on it.
List Levels
As you could note, the lists or tuples presented before are nested in another list [].
vertices = [(0,0,0),(0,1,0),(1,1,0),(1,0,0),(0,0,1),(0,1,1),(1,1,1),(1,0,1)]
edges = [ [0,1],[1,2],[2,3],[3,0],[4,5],[5,6],[6,7],[7,4],[0,4],[1,5],[2,6],[3,7] ]
polygons = [ [4,5,1,0],[5,6,2,1],[6,7,3,2],[7,4,0,3],[7,6,5,4],[0,1,2,3] ]
Sverchok lists can be nested on many levels. We start counting from 0 incrementing the counting as more nested levels are included.
For example:
level_one_list = [1,2,3,4]
level_two_list = [ [1,2,3], [4,5,6,7], [8,9,10] ]
level_three_list = [ [ [ 1,2,3] , [4,5,6,7] ] , [ [8,9] , [10,11,12] ] ]
In Sverchok the elements at level 0 are objects. For example, in the previous examples, level_one_list has 4 objects, level_two_list has 3 objects, and level_three_list has two objects.
Let’s start it!
We have learnt how Sverchok organises data structures. Let’s make something more interesting. In this Hello World tutorial, we are making a Panelised Sine Wave Structure.
The first thing that we need to do is breaking our problem into small steps. So if we want to create Sine Wave like grid structure, first of all, we need to build a grid of vertices in the first place, but first need to know how to create a sequence of vertices, but before it comes to how to make a vertex.
We now roughly know the steps that we need to follow towards the final design:vertex -> sequence of vertices -> grid -> Sine Wave like grid structure. We are going to add complexity to our algorithm incrementally. As we have seen before, a vertex is represented by a vector in the (x,y,z) Cartesian space. We can define a vector using a number for each (x,y,z) axis. To create a number in Sverchok, first, we create a new node clicking in New Node, then we can use Shift+a to access the floating panel and get Number -> a number then click in the canvas. We can define a number as a float number (with decimal points) or int (with no decimal points). Also, we can slide or click the panel at the bottom to increase or decrease the value of our number. To change the possible range of a number (change its minimum and maximum value), we can click into the gears of the node and choose the min and max values.
So to create the vertex, we need 3 numbers, one for x, another for y, and another for z. Let’s make two more as we did before or copy and paste the existing one with Crtl+C, Ctrl+V.
Now, we can create the vertex (vector) by using the node called Vector In, in Vector > Vector in.
I did not mention it yet, but Sverchok nodes are functions that operate values as inputs on the left side, mapping those values as an expected outcome as an output or outputs. In Sverchok, generally, inputs go into the left side, while outputs come out on the right side.

To run a Sverchok node, we just need to connect the output from one node into the input of another and get the expected result in the output of the second node. To create a vector, we can connect each number output to the input X, Y, Z of the Vector in. To visualise the vector node, we can add another node called Viewer Draw( Viz -> Viewer Draw), connecting the Vector in output into Vertices input.
Also, we can visualise the vertices properties using the node Stethoscope MK2, under Text -> Stethoscope MK2 or using Viewer text Mk3 under Text -> Viewer text mk3. To visualise as a text rather than a frame in the Sverchok canvas, uncheck the box frame and go to the Blender Text editor Viewport and choose text in the Sverchok_viewer. Sverchok automatically creates this text for us.
We can check that we have 1 object of the type VERTICES in (x,y,z) coordinates corresponding to the chosen numbers.
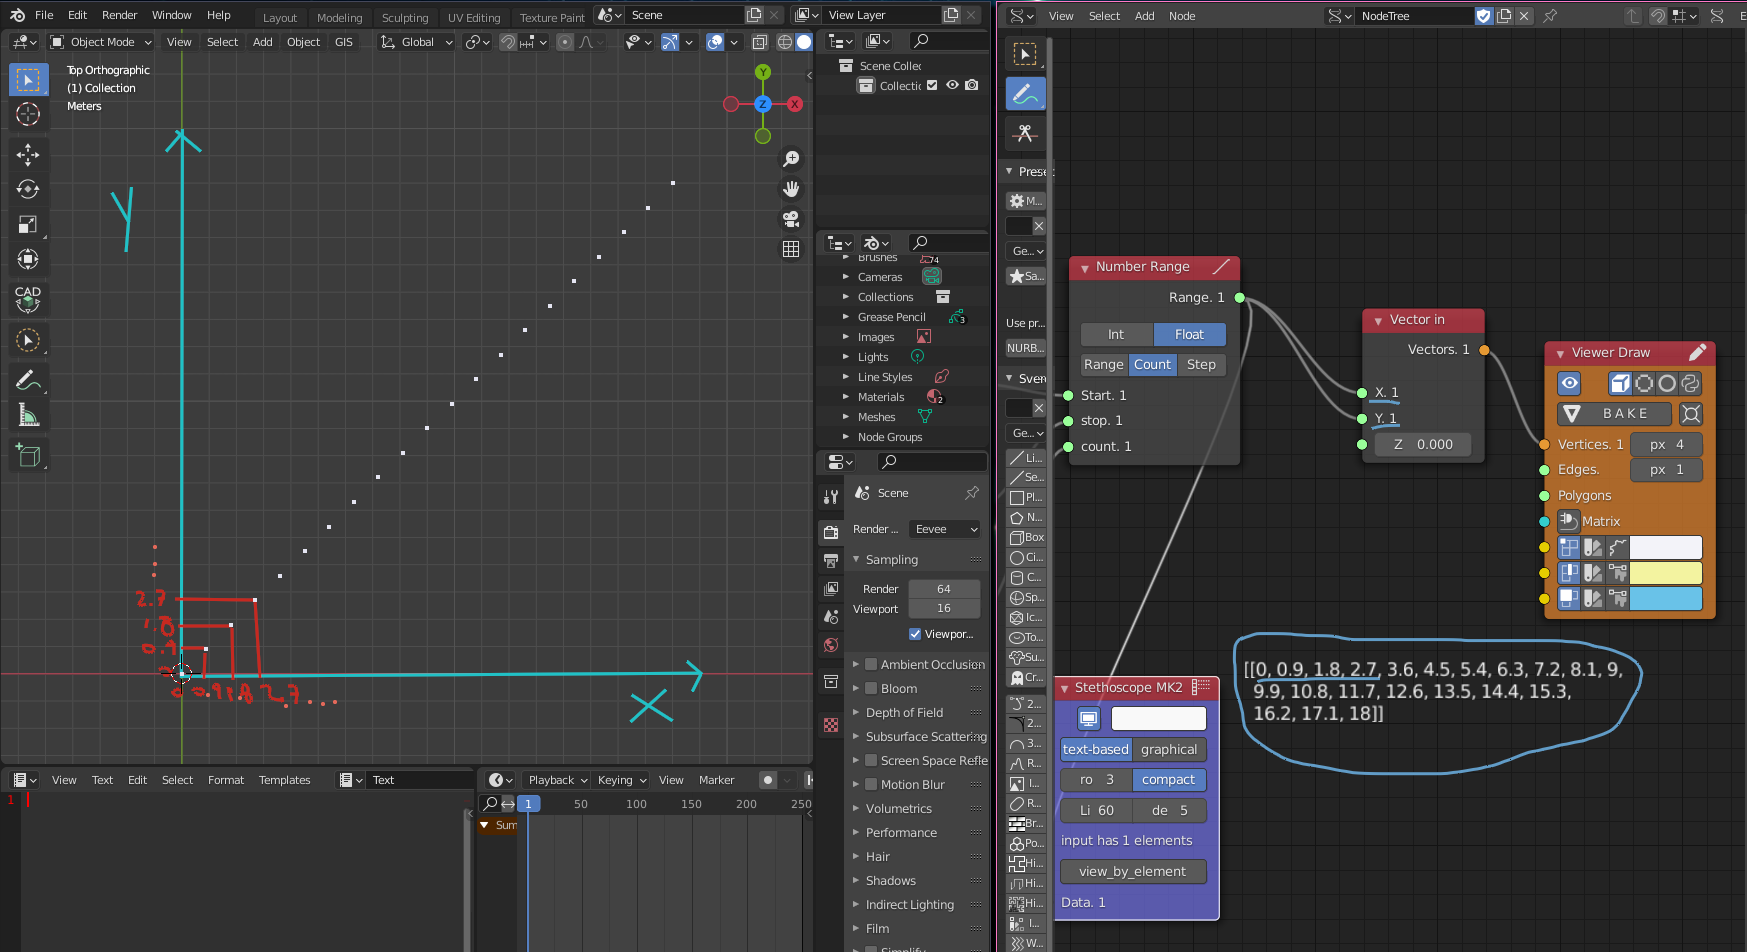
The next step is to create a sequence of vertices. First, we need to create a sequence of numbers that will fill (x,y,z) of the Vector in node. We can use the node Number Range ( Number -> Number Range). There are three different methods of creating a list of numbers: Range, Count, and Step, using Range, we can define a start point, a stop an endpoint, and step that will establish the steps from one number to another inside the predefined range. Count we define the start and stop and count, which means how many numbers will have inside the range (The steps will be base on the count variable). The last option is Step, in which we define start, step, and count(the stop number will be defined by the node).
In our example, we are going to use the method Count. This example defines start as 0, stop as 20, and count as 25, and we can play with these numbers later. The next step is to plug the output Range of Number Range into the input X of Vector in, and then we can have a Viewer Draw to visualise our sequence of vertices. Now we can play with the number and see how it changes the number sequence.
So, what’s happening if we plug the same output Range from the Number Range node into the input Y of Vector in?
We just shift the vertices in the Y direction as well, but if we want to have a grid of vertices, what is the next step?
So we just need to cross-reference the matrix between X and Y using the node List Match (List -> List MAin -> List Match and choose the option X-Ref.
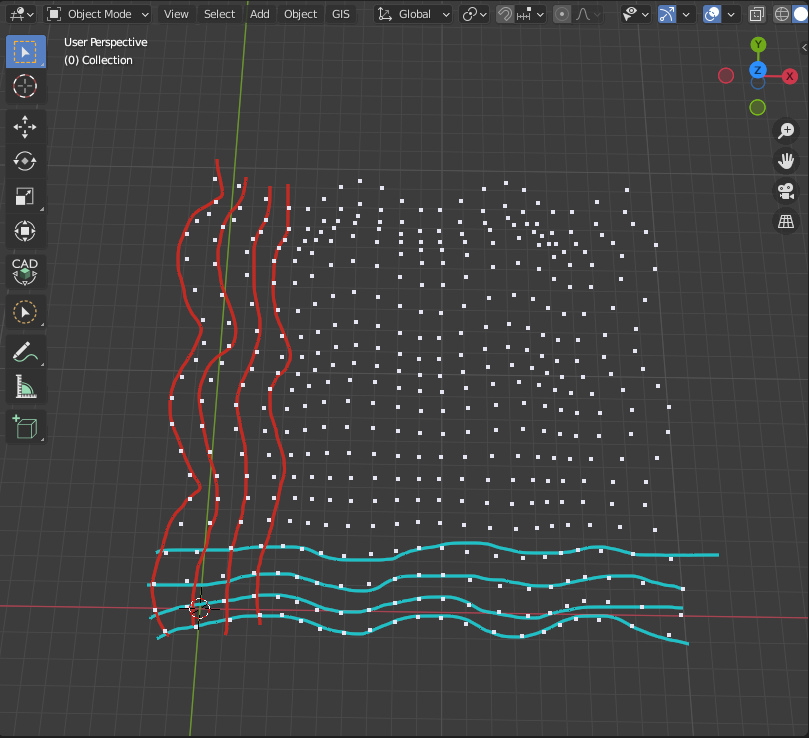
The next step is to transform the flat grid point into a sine/cosine grid. To make it, we define a cosine variation for X axis (x), a height for the curvature (h), a displacement distance for the grid stay above of the ground (d), a sine variation for Y axis (y), and a factor for multiplication to amplify the curvature (f)
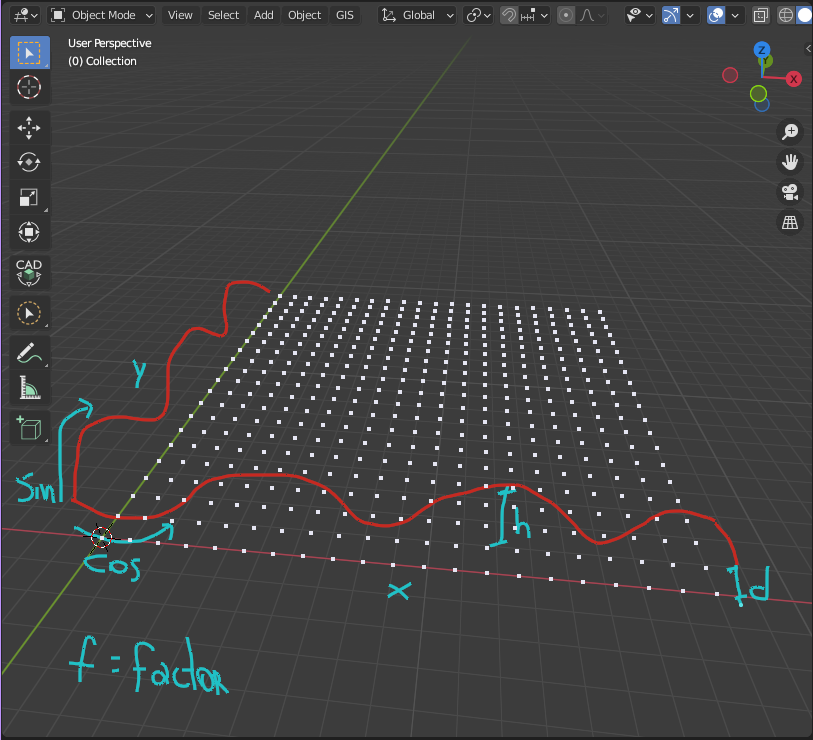
The formula for this variation is:
d + (h*((cos(x)/f)+(sin(y)/f)))
We use the node Formula (Script -> Formula) to use it in Sverchok.
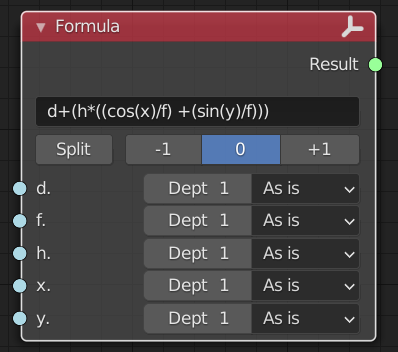
We can use an A Number (Number -> A Number) for each value of d,f, and h. Both x and y will receive corresponding values from List Match.
To create panels, first, we divide the list into several lists with the same number of points in both dimensions.
To do that, we use the node List Split (List -> List Struct -> List Split). After that, we use the node List Flip to transpose the matrix of points in the other direction.
After that, we are going to use both lists to build the panels. The node used to make panels in Sverchok is called UV Connection (Modifiers -> Modifiers Make -> UV Connection). We choose option V and uncheck the option slice, connecting the outputs of List Split and List Flip in vertices and vertices 1.
To divide the panels into triangular panels we can use the node Poke Faces (Modifiers -> Modifiers Change -> Poke Faces).
To create the openings in the panels we can use the node Inset Faces(CAD -> Inset Faces), then we mask the list just to get or frames or panels, using the node List Mask (List -> List Mask (out)).
To make it more interesting, we can use a parametric relation to transform the panels dynamically according to the height of the curvature of the sine wave. To create this effect, we need to work with some logical operators.
First, we need to determine the centre point of each panel. To do that we can use the node Origin (Analyzer -> Origins).
Next, we can deconstruct the centre points into the corresponding x,y,z values, using the Vector Out node (Vectors -> Vector Out).
We can use a threshold value to determine the height for the panels to start to change form. Therefore, we use the node A Number and summing it to the number of displacement d determined previously, using the node Scalar Math, choosing the option Add (Number -> Scalar Math (Add)).
Now we can compare if the z value of the centre points are bigger than our threshold, using the node Logic Functions choosing the options >(Logic -> Logic Functions (>))
We can divide the panels between above and below the threshold. First, we mask the output from the Logic Functions node using List Mask and level list equal 2.
The next step is to delete the vertices that do not have faces associated with them, using the node Delete Loose (Modifiers -> Modifiers Change -> Delete Loose).
Now we can connect Delete Loose output into Poke Faces input and check for the filtered result.
To create the second part of the surface, we need to get the inverse mask from the previous one. We first use the node from Logic Functions called not and connect in the output of our list mask, inversing the boolean logic from the list, which means that every True condition will become a False and the same for the opposite. After that, we copy and paste the following nodes deleting the Poke Faces nodes from the sequence. The panels will be created as a single rectangular panel in this second part differentiating from the first one of triangular panels.
Finally, we can replace Viewer Draw with Mesh Viewer, creating real-time meshes into the blender scene that can be animated. Also, we can put an extra Mesh Viewer for the panels getting the data false parameter from the List Mask node.
Now we can play with the parameters and parametrically change the geometry.
You can download the blend file here
Have fun!